Moving and Migration Statistics Australia
With 43% of people aged 15 years and over having moved in the last five years, the moving industry represents a surprisingly large part of the Australian economy. Australians represent one of the most mobile populations in the world.

Key takeaways
- 43% of Australians aged 15 and over have moved in the past five years.
- Moving is influenced by life transitions such as work, education, relationships, illness, or downsizing.
- More than a million Australians are prompted to move due to increased interest rates, rent rises, power bills, and cost of living pressures.
- Two-thirds of moves occur between October and March, coinciding with the spring selling season.
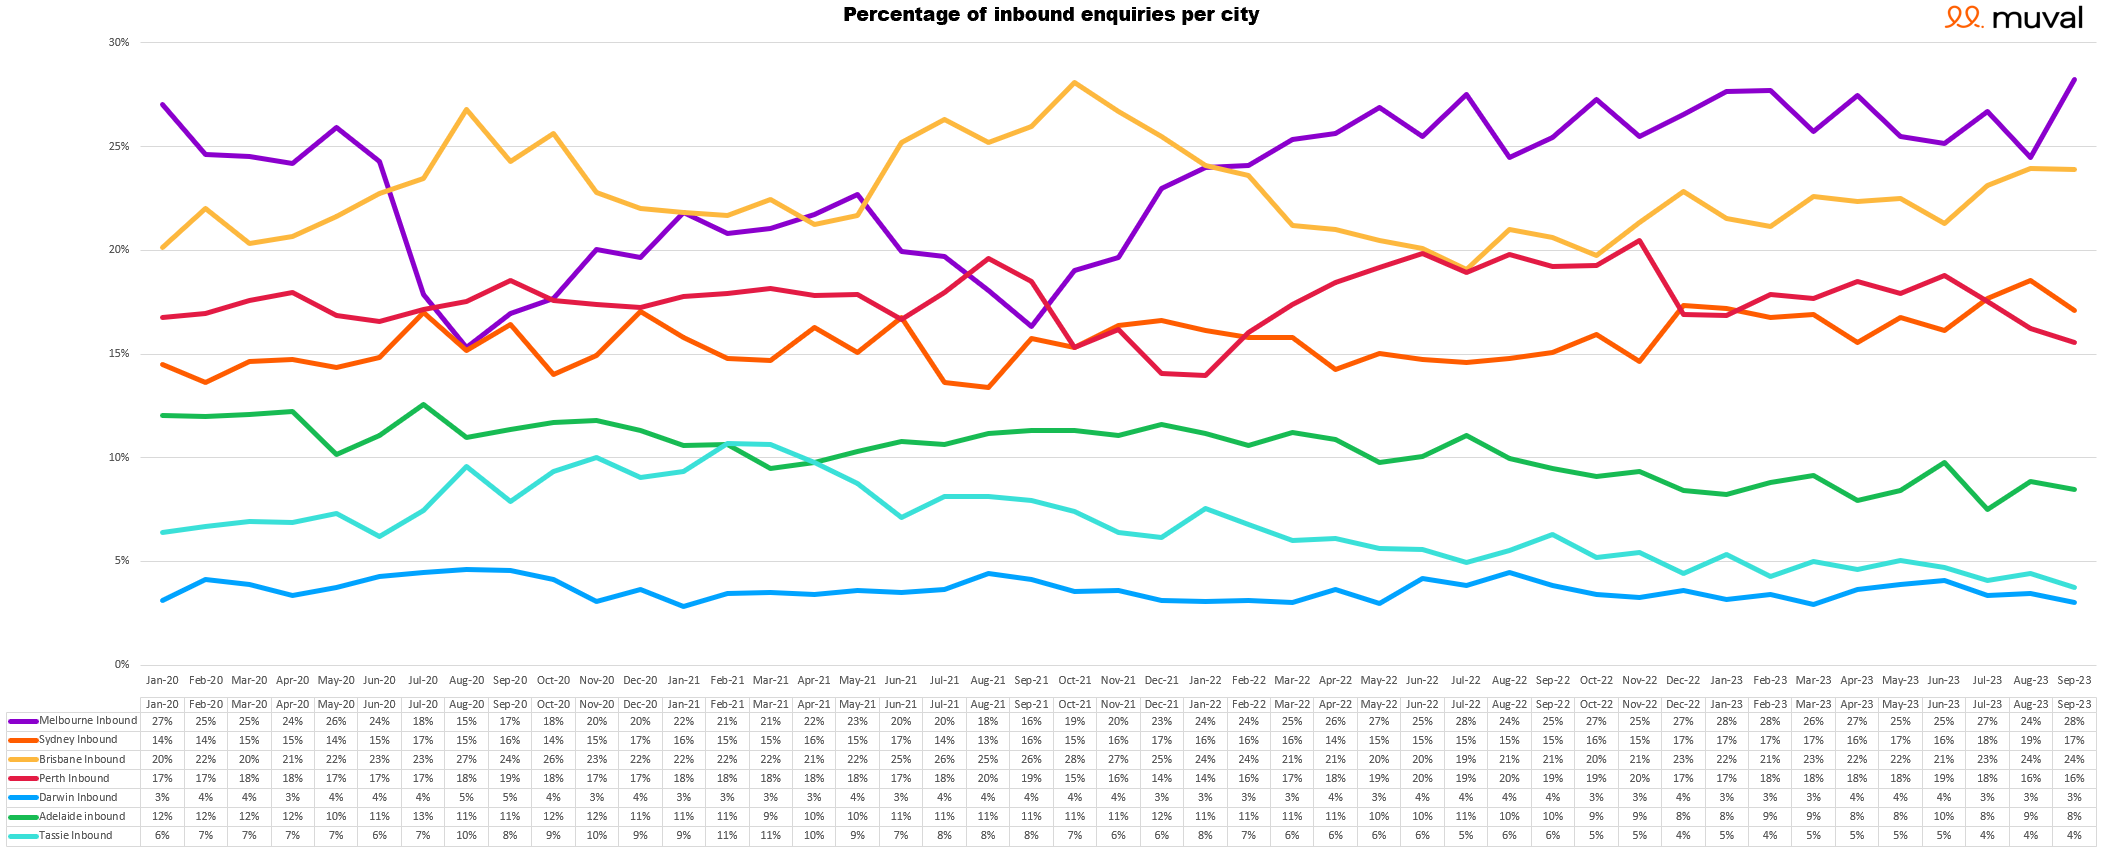
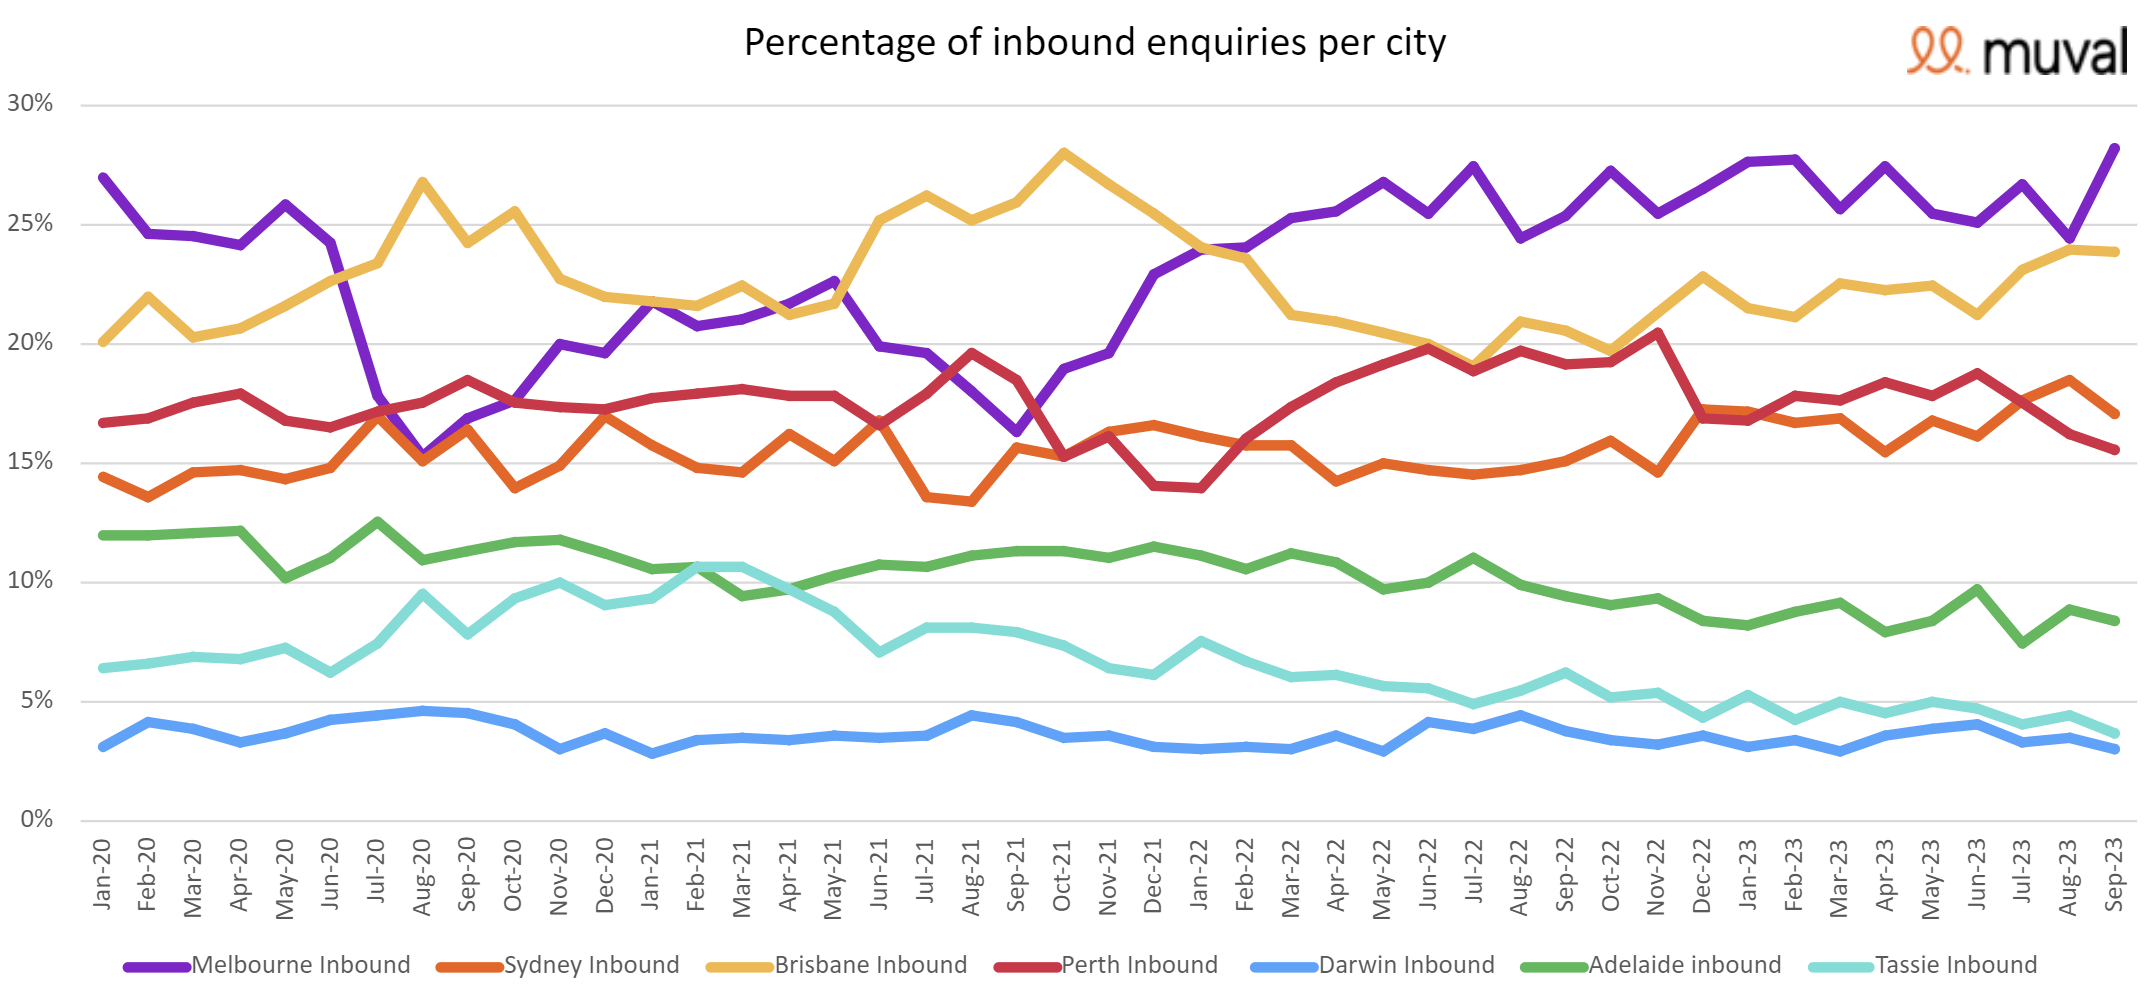
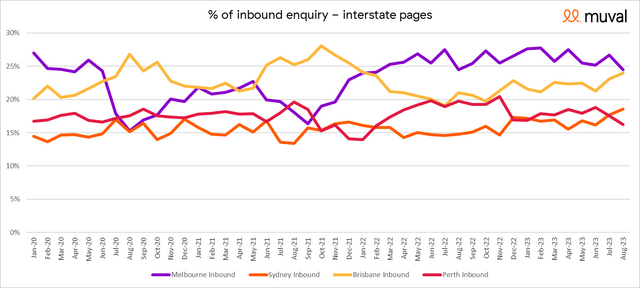
- Melbourne has the highest inbound metro moving enquiries as of September 2023, with 28%.
- Brisbane follows Melbourne with 24% of metro moving enquiries, reflecting a slight decline from August.
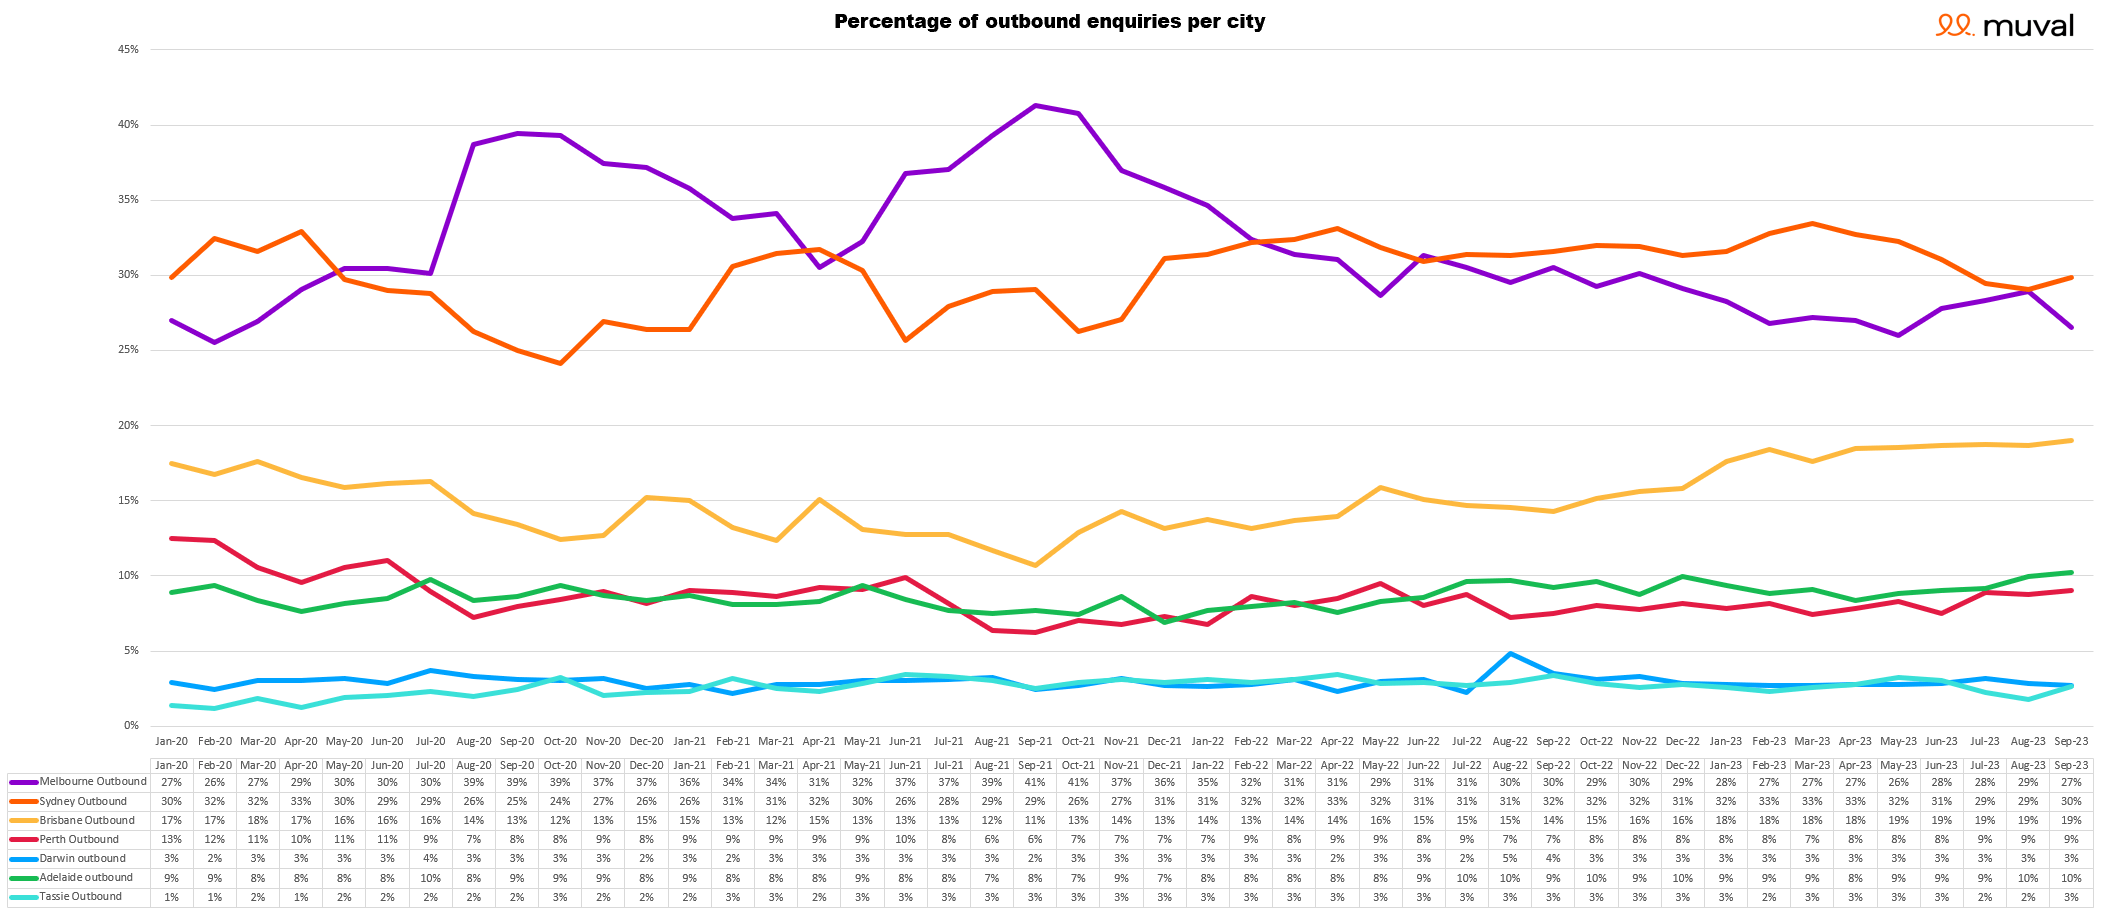
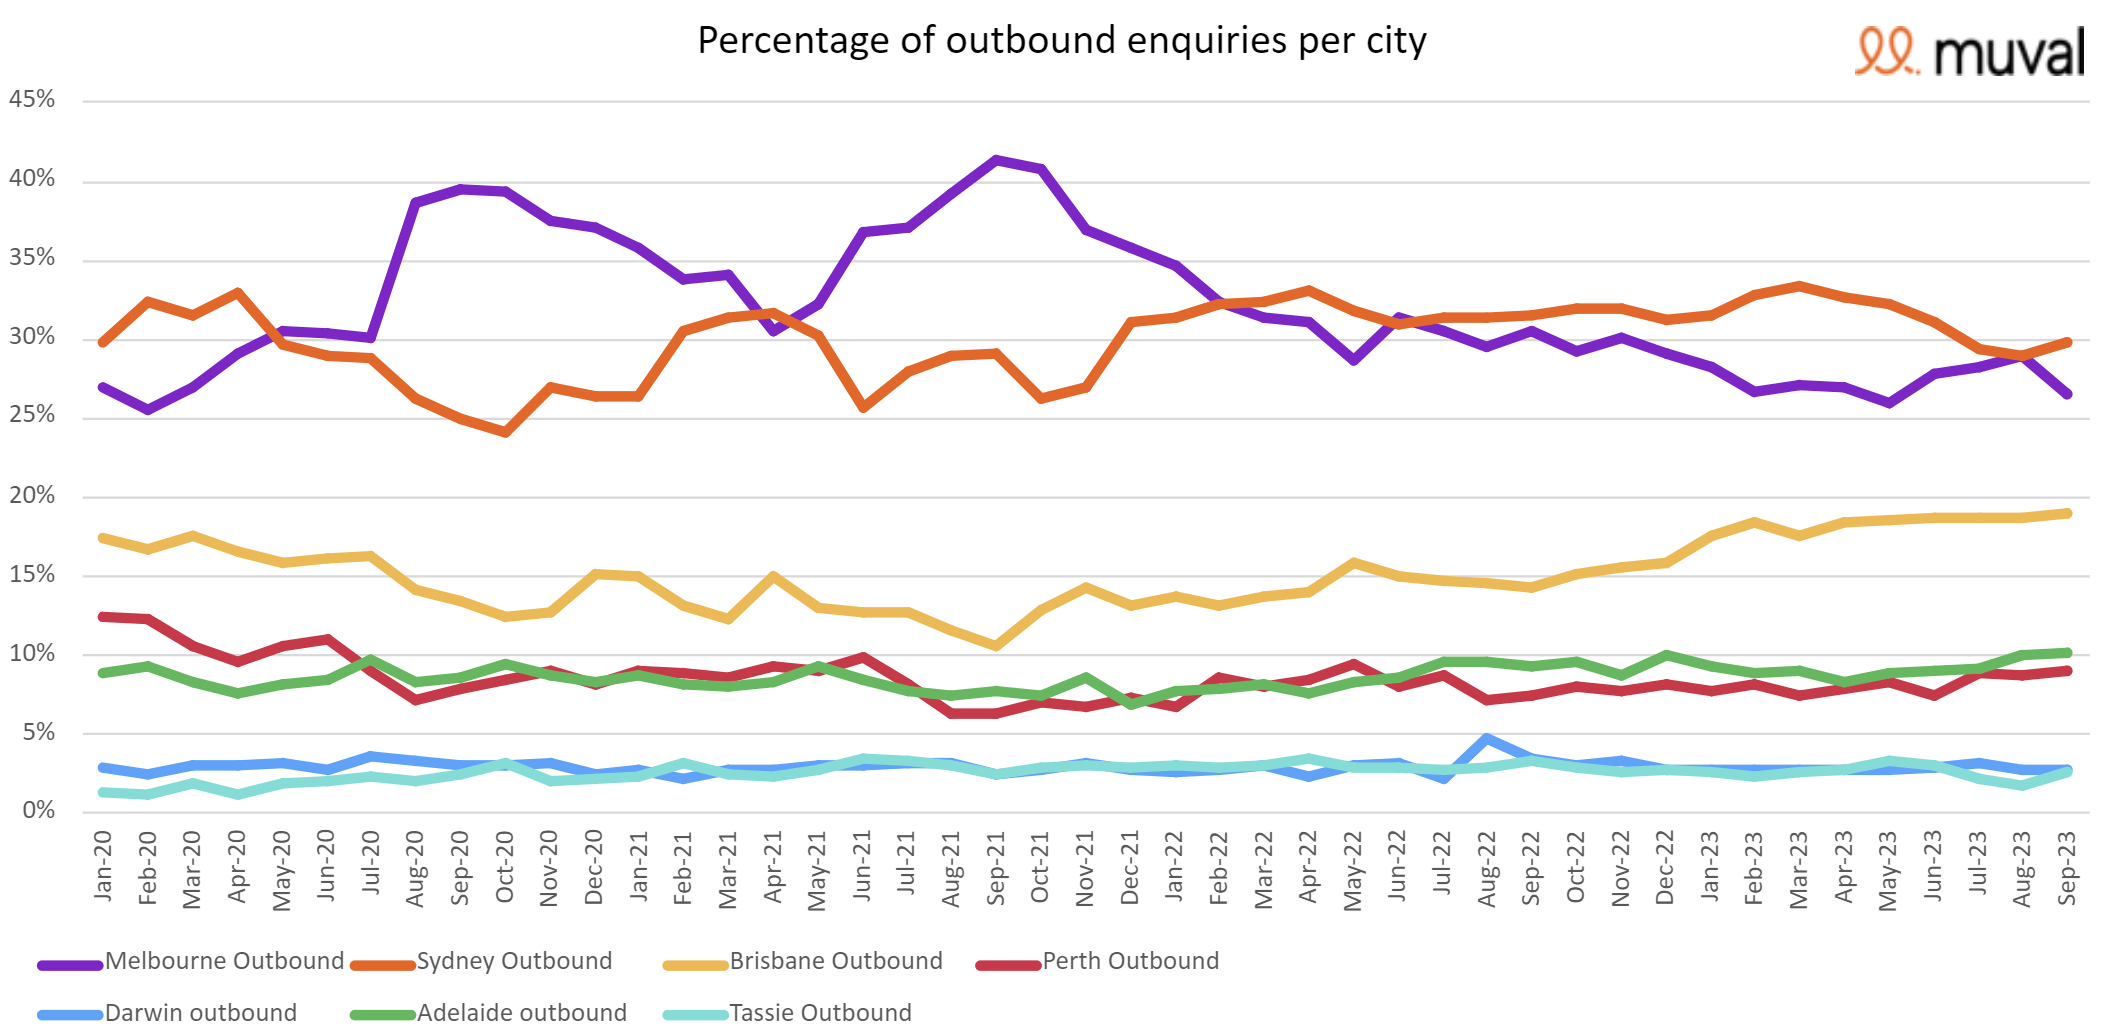
- Sydney has the highest outbound moving enquiries in September 2023, with 30% of metro moves.
- Perth maintains the highest net migration in the country but is trending downwards.
- Adelaide has experienced negative net migration for 14 consecutive months as of September 2023.
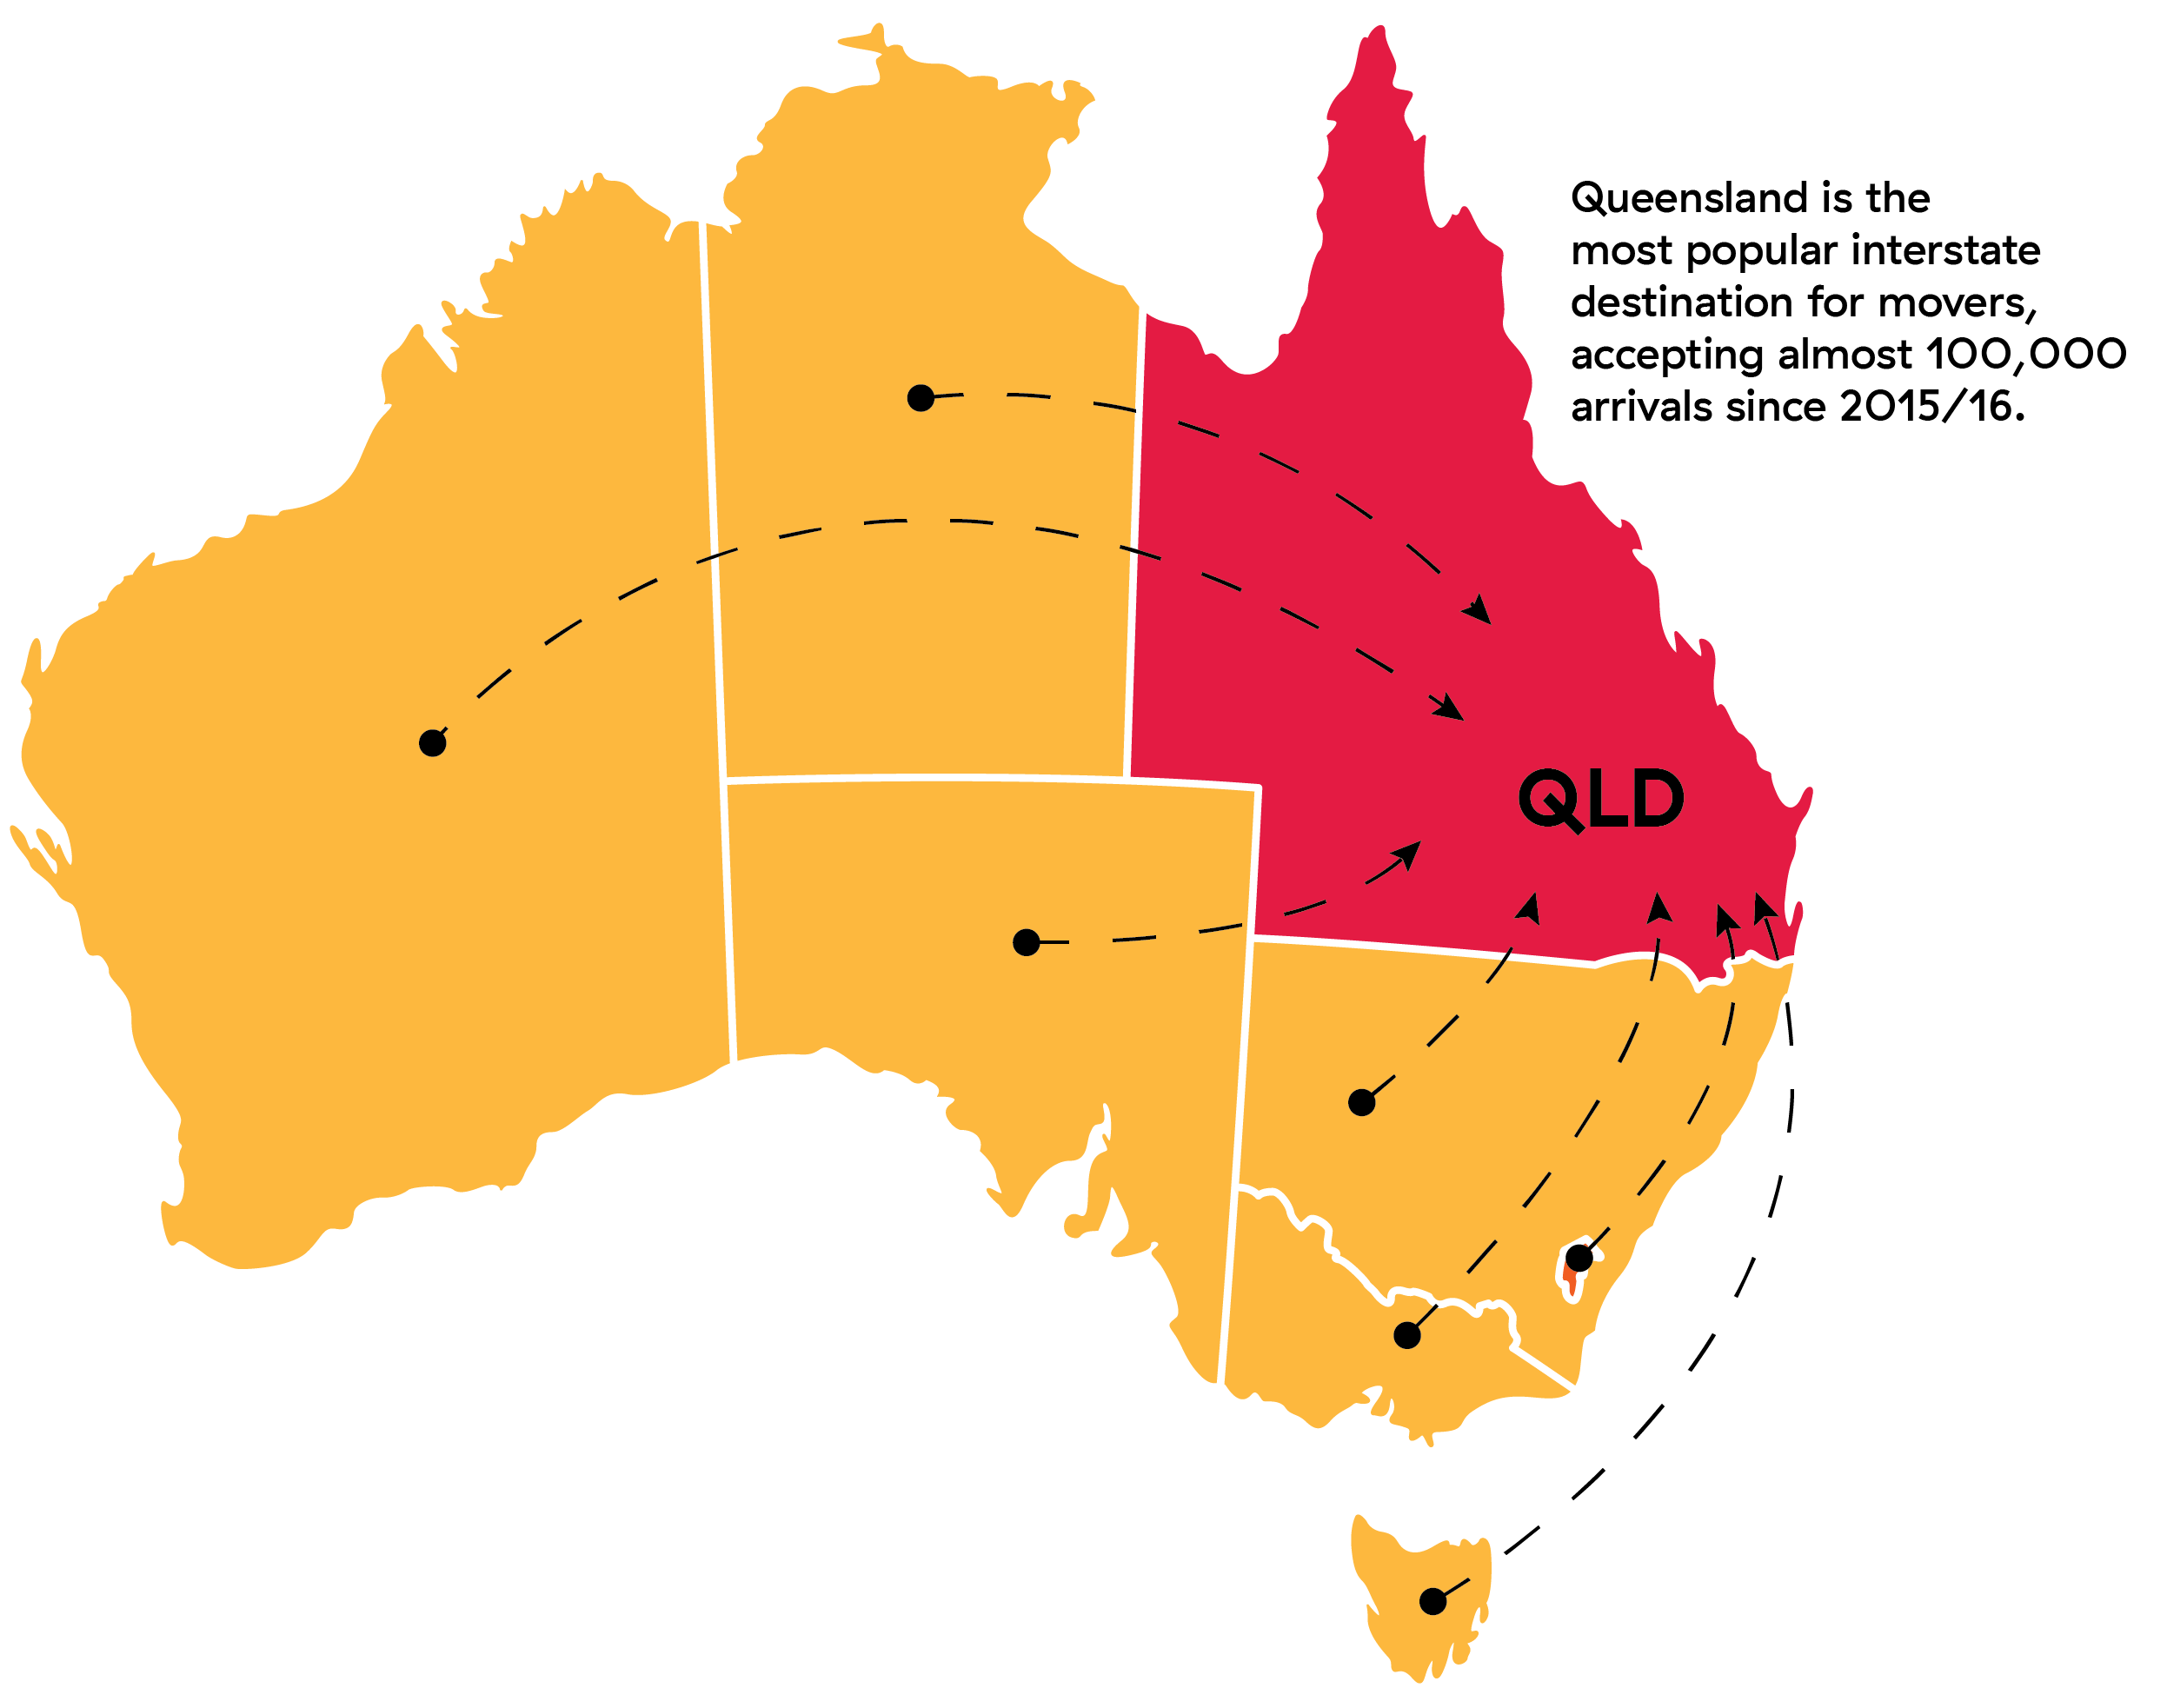
- The most popular interstate moving destination is Queensland, with almost 100,000 arrivals from 2015-16.
- NSW saw over 100,000 departures in 2015-16, marking it as the state with the most outbound movers.
- 85% of Australians who move each year stay within the same state.
- The Australian removalist industry is valued at $2 billion AUD annually, with wages being the largest expense.
Whether thanks to life transitions such as moving for work, education or a relationship, or moving due to illness or disability (or just because of a desire to downsize) that is more commonly seen in older people, a significant number of people move locally in Australia. Here are the facts and figures on Aussies moving around Australia.
It's Moving Season!
& Internal Migration in Australia September 2023
It’s officially ‘moving season’ down under and this season is tipped to be bigger than usual as increased interest rates, record rent rises, soaring power bills and cost of living pressures prompt more than a million Australians to move.
Typically around two-thirds (66%) of all moves take place between October and March as more than 1.5 million Australians move into new homes purchased during the spring selling season and renters move around as leases start and end.
While rent moves are traditionally local, within the same suburb or neighbouring suburbs, Australians are increasingly moving interstate to rent or buy, crossing borders in search of more affordable housing and lifestyles, or in search of employment.
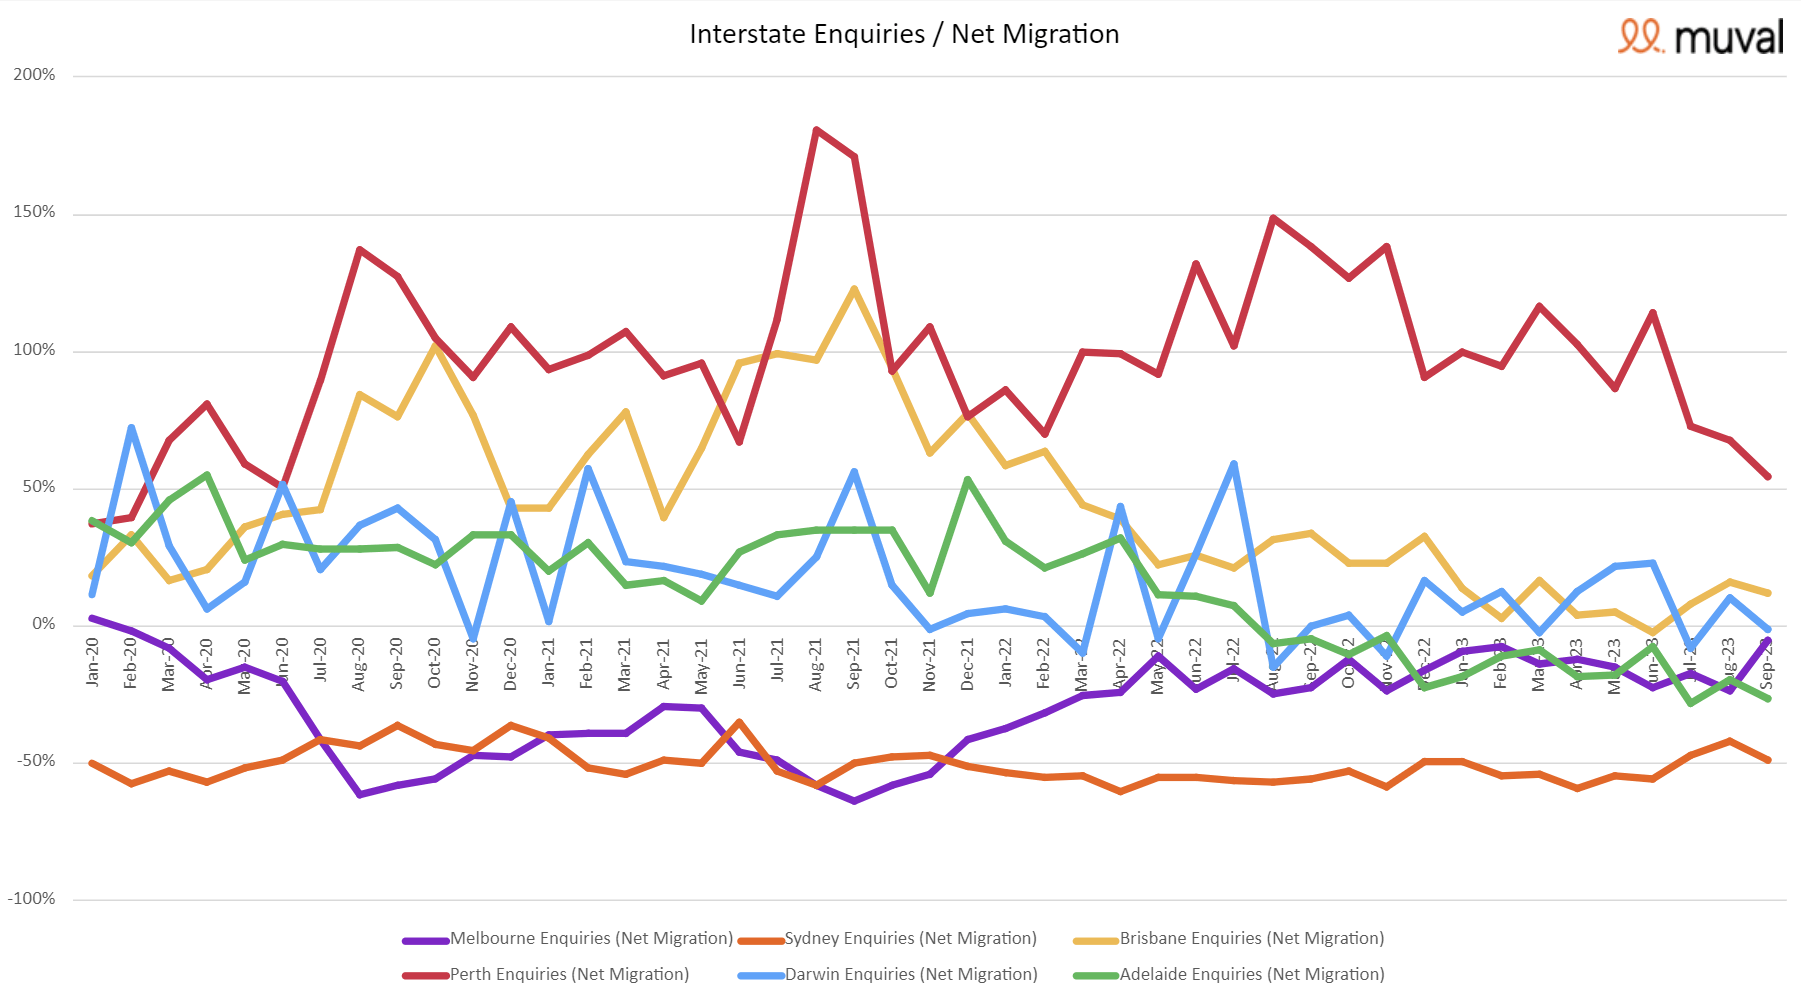
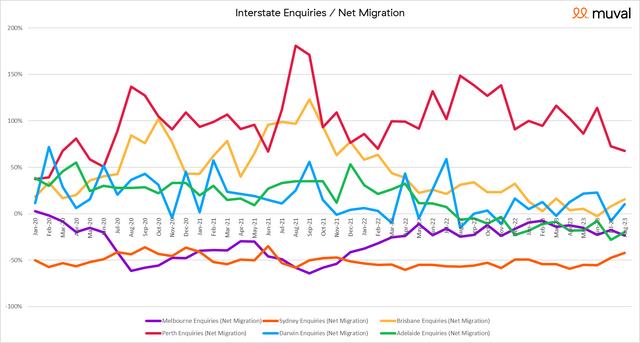
According to national online removalist booking platform Muval, which has the most up-to-date internal migration data showing where Australians are moving, interstate moves are trending up as we head into ‘moving season’, and Melbourne and Brisbane are the summer hot spots, as Perth, Sydney and Adelaide’s popularity wanes.
As people typically enquire about removalists up to 30 days before they move, Muval’s data is a proven early indicator of moving trends in Australia.
Melbourne
With 28% of all metro inbound moving enquiries in September headed for Melbourne, the southern city has reclaimed the standalone position as the number one place to move in Australia. In August, Melbourne was tied with Brisbane on 24% a piece. In even more positive signs for Melbourne, net migration climbed from -24% in August to -5% in September, the closest it has been to positive net migration since before the pandemic (+3% Jan 2020). Melbourne's outbound enquiries have veered down as Sydney’s trend up, dropping from 29% in August to 27% in September.
Brisbane
After a month on par with Melbourne in terms of inbound metro moving enquiries (both 24% in August), Brisbane remained on 24% in September, slipping back into second place as Melbourne pulled ahead with 28% of metro moves. Brisbane's net migration has dipped slightly to +12% in September from +16% in August. Outbound moving enquiries remain steady on 19% for the fifth month in a row.
Sydney
While Sydney experienced its first positive steps post pandemic following the Reserve Bank’s initial rate pauses, the market has slipped in September. According to Muval’s latest moving data, Sydney accounted for the most outbound moving enquiries in September. At 30% (down from 29% in July and August), almost one in three metro moves was from Sydney. Inbound moves were also down in September, with Muval’s data showing that 17% of all metro inbound moving enquiries were to Sydney, down from 19% in August (the highest it had been since Muval started collating data at the start of 2020), putting Sydney behind Melbourne and Brisbane as only the third favoured city to live in. With more people moving out than in, Sydney’s net migration took a turn for the worse, dropping back to negative -49% in September from -42% in August.
Perth
Perth's net migration is still the highest in the country, but it's spiralling fast to pre-pandemic levels as interest in the state tapers off. In September it was +54% (the last time it was this level was mid 2020), down from +68% in August and a far cry from the 2021 pandemic high of +181%. While outbound moving enquiries remained steady on 9%, inbound moving enquiries were trending downwards accounting for 16% of all metro moves in September, down from 19% in June.
Adelaide
Adelaide is in its 14th straight month of negative net migration based on moving enquiries, with Muval’s latest figures showing a dip from -20% in August to -26% in September. Outbound migration remains on 10% in September, the same as August and up from 9% in May-July, while the city received just 8% of all major metro inbound moving enquiries.
Internal Migration in Australia August 2023 - Facts
There have been some noteworthy shifts in moving enquiries since the Reserve Bank began pausing rates in July. According to Muval’s latest moving data, Sydney and Brisbane are the winners of the rate pauses, while Melbourne and Perth are trending down since the July pause.
Sydney
After two months of rate pauses, Sydney is experiencing its first positive steps post pandemic. According to Muval’s latest moving data to the end of August 2023, Sydney accounted for 19% of all metro inbound moving enquiries in August - the highest it has been since Muval started collating data at the start of 2020. Outbound moving enquiries are also trending down, reaching below 30% for the first time in two and a half years (29% in July and Aug, down from 31% in June). The Harbour City’s net migration is continuing in a positive direction. It's still in negative territory but it's trending up (from -56% in June to -47% in July and -42% in June) as Perth and Melbourne trend down.
Brisbane
Brisbane is now on par with Melbourne in terms of inbound metro moving enquiries (both 24%) - the first time in over a year Melbourne hasn't been the stand alone #1 metro moving destination in Australia. Brisbane's net migration is also rising since rates were paused – it has rebounded from negative territory in June (-3%) to +8% in July and +16% in August. Outbound moving enquiries remain steady on 19%.
Perth
Perth's net migration is still the highest in the country, but it's back to pre-pandemic levels. In August it was +68%. The last time it was this level was March 2020. While outbound moving enquiries remain steady on 9%, inbound moving enquiries are shifting downwards accounting for 16% in August, down from 19% in June.
Melbourne
Melbourne was trending up in July, accounting for 27% of all metro inbound moving enquiries, but has taken a downward turn in August to 24%, the same as Brisbane, losing its mantle as the stand alone #1 place to move in Australia. Its net migration also slipped further into negative (-24% in Aug) after nearing positive net migration in February (-8%). Melbourne's outbound enquiries (29% in Aug, up from 28% in June) are going up as Sydney's begin to veer down.
Adelaide
Adelaide is in its 13th straight month of negative net migration based on moving enquiries, but the latest figures show a bounce back from -28% in July to -20% in August. Outbound migration has risen to 10% in August, up from 9% May-July, while the city received 9% of all major metro inbound moving enquiries.
Internal Migration in Australia 2021 - Quick Facts
- In 2018-19, there were 404,000 interstate movers - a year on year increase of 2.9%
- 76,200 people moved interstate within the September quarter of 2020, with capital cities having a net loss of 11,200 people due to internal migration
- 56% of Australians under the age of 30 were still living at home in 2017 - an increase of 9% when compared to young Australians in 2001
- Just over 40% of Australians move every five years, more than twice the worldwide average
- 85% of Australians who move each year stay within the same state.

- Queensland is the most popular interstate moving destination amongst Australians, with almost 100,000 arrivals from 2015-16
- In 2015-16, the Australian state with the most outbound movers was NSW, which saw over 100,000 departures
- The most common internal migrations in Australia involve moving away from Sydney
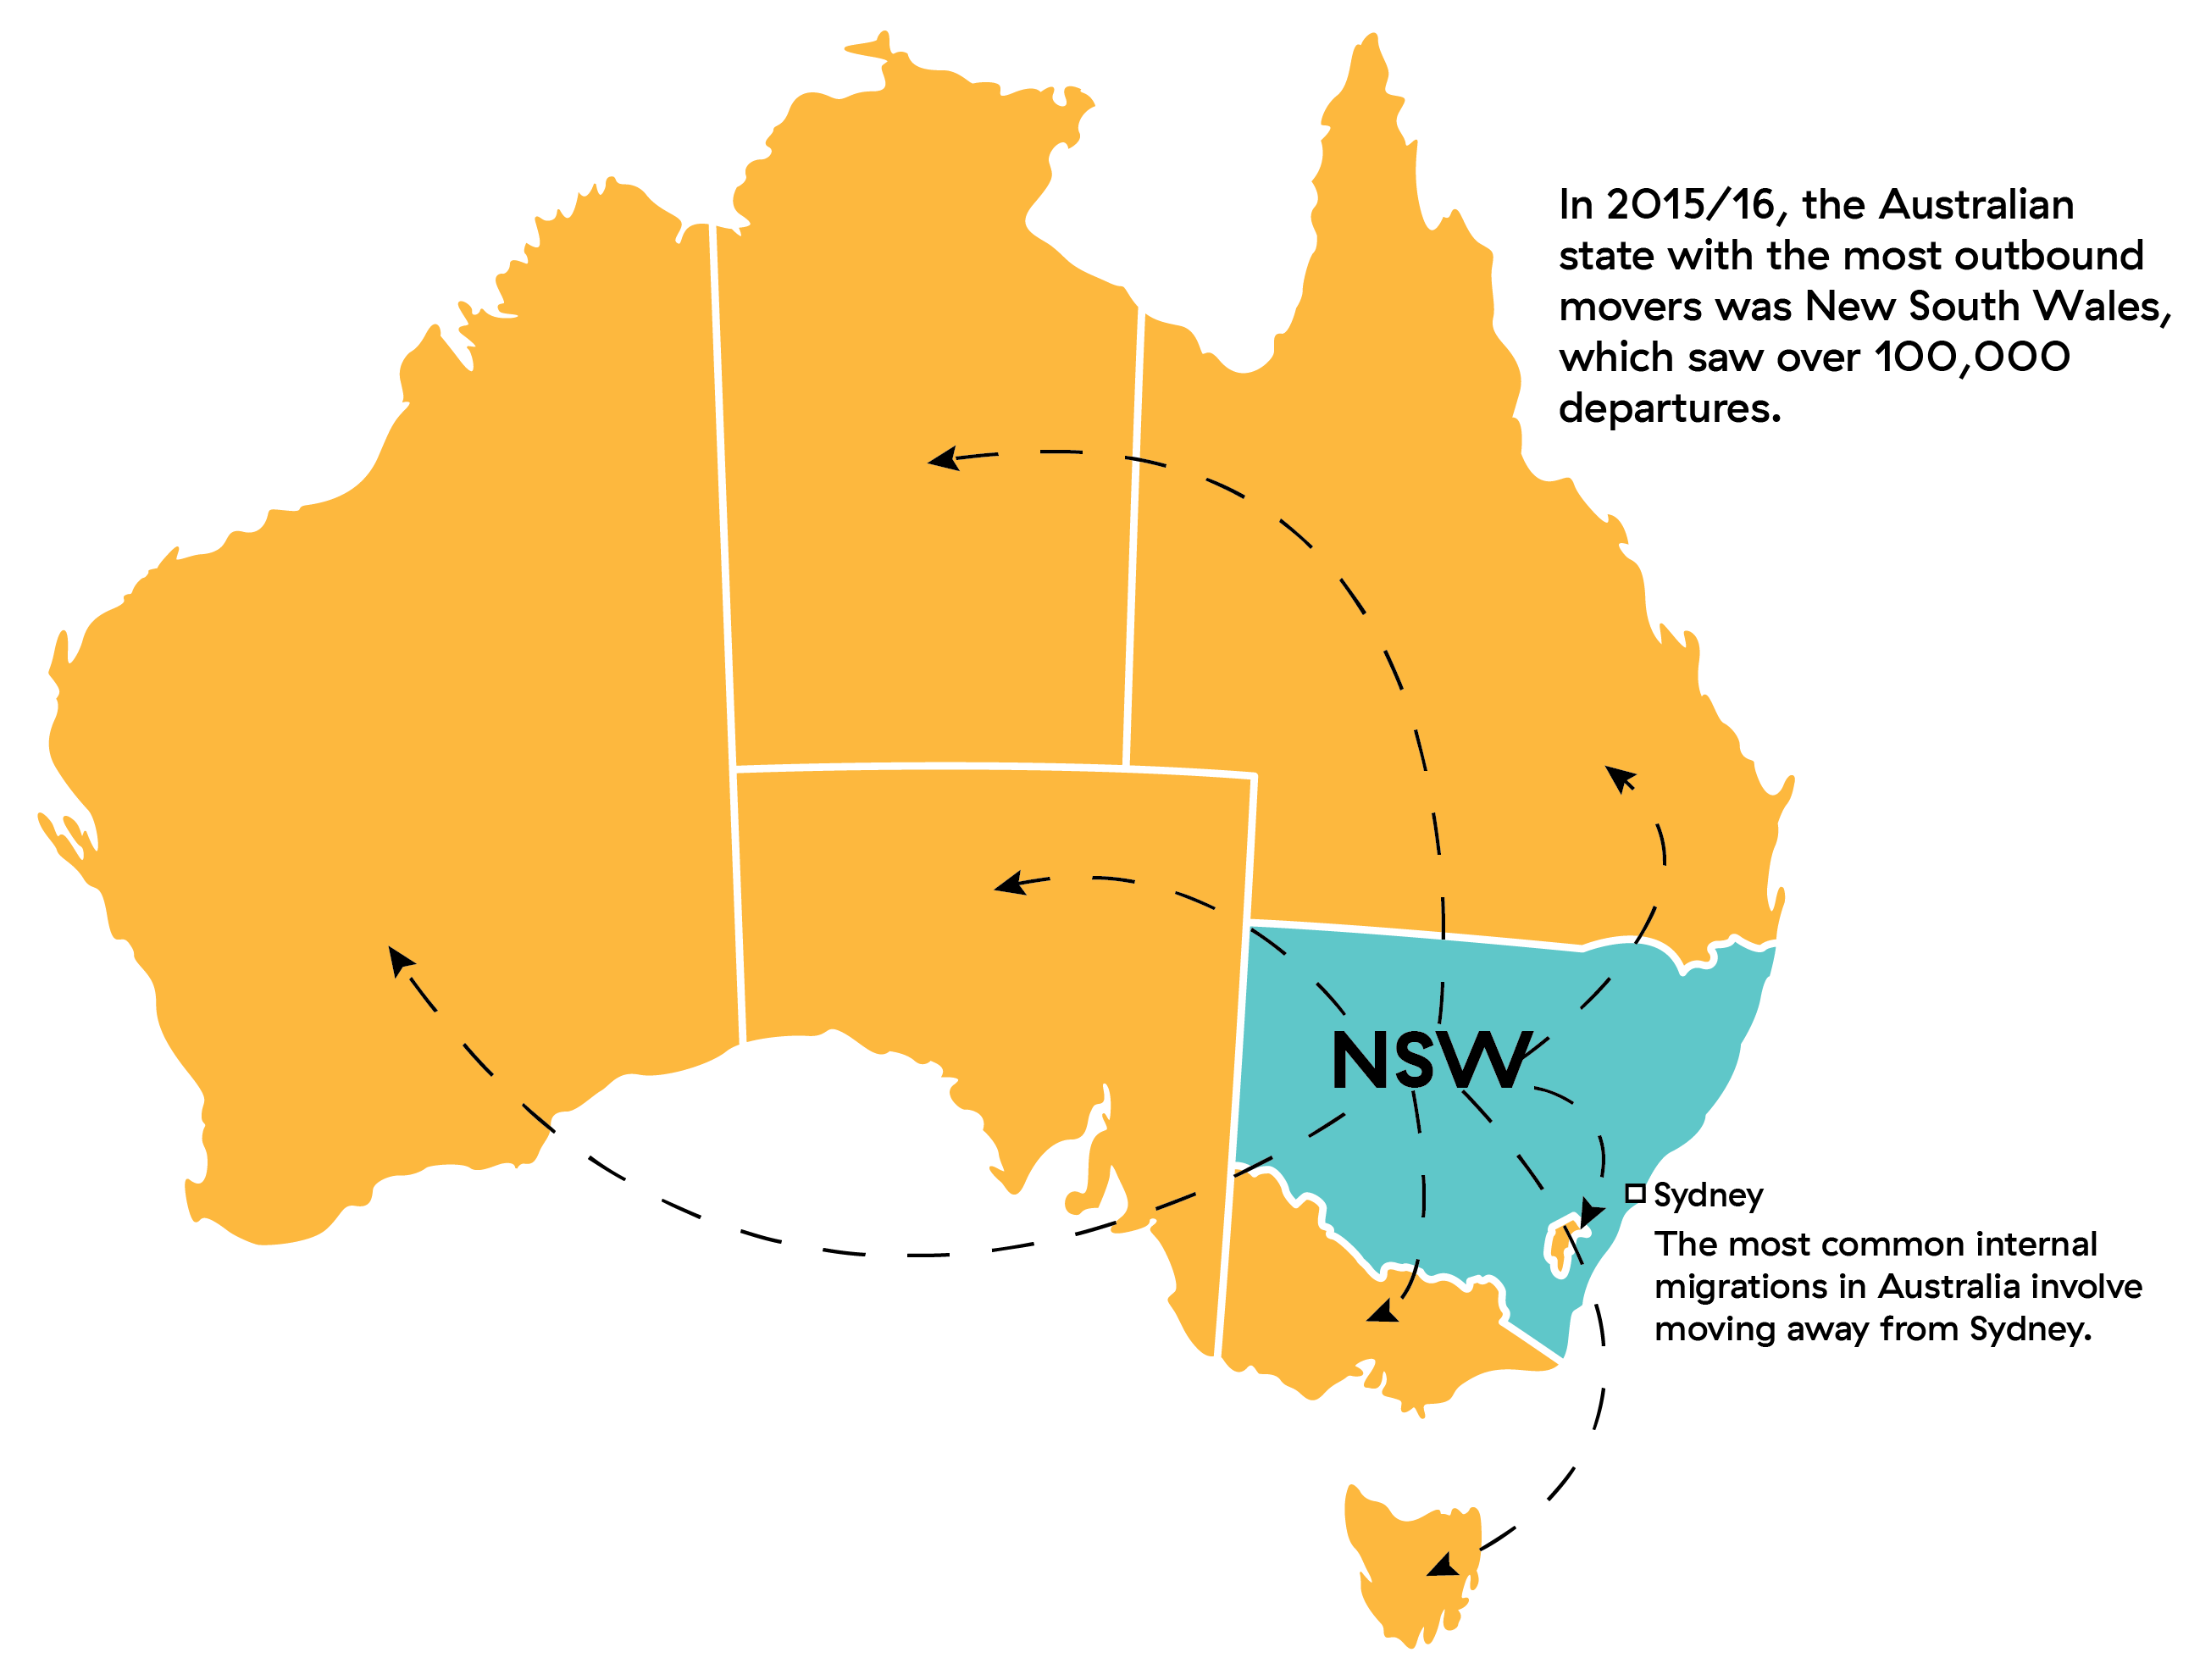
- In 2017, the most common reason for moving between states was work - this marks a significant shift from 2002, where family was the most common reason
- 25-29 year olds are the age group most likely to be recent movers, based on 07-08 ABS data

- The percentage of young people aged 20-34 living with their parents increased to 23% in 2006, from just 19% in 1986.
- Based on 06-07 data, 46% of the Australians leaving home before their mid 30s returned home at least once
- Between 1901 and 2016, the United Kingdom has consistently remained as the top country of birth of new Australian arrivals
- In 2015-16 professional migrants found that Australia was the fourth most popular moving destination, behind France, the UK, and the US
- In 2005, 60% of people moving house moved a distance of less than 10km
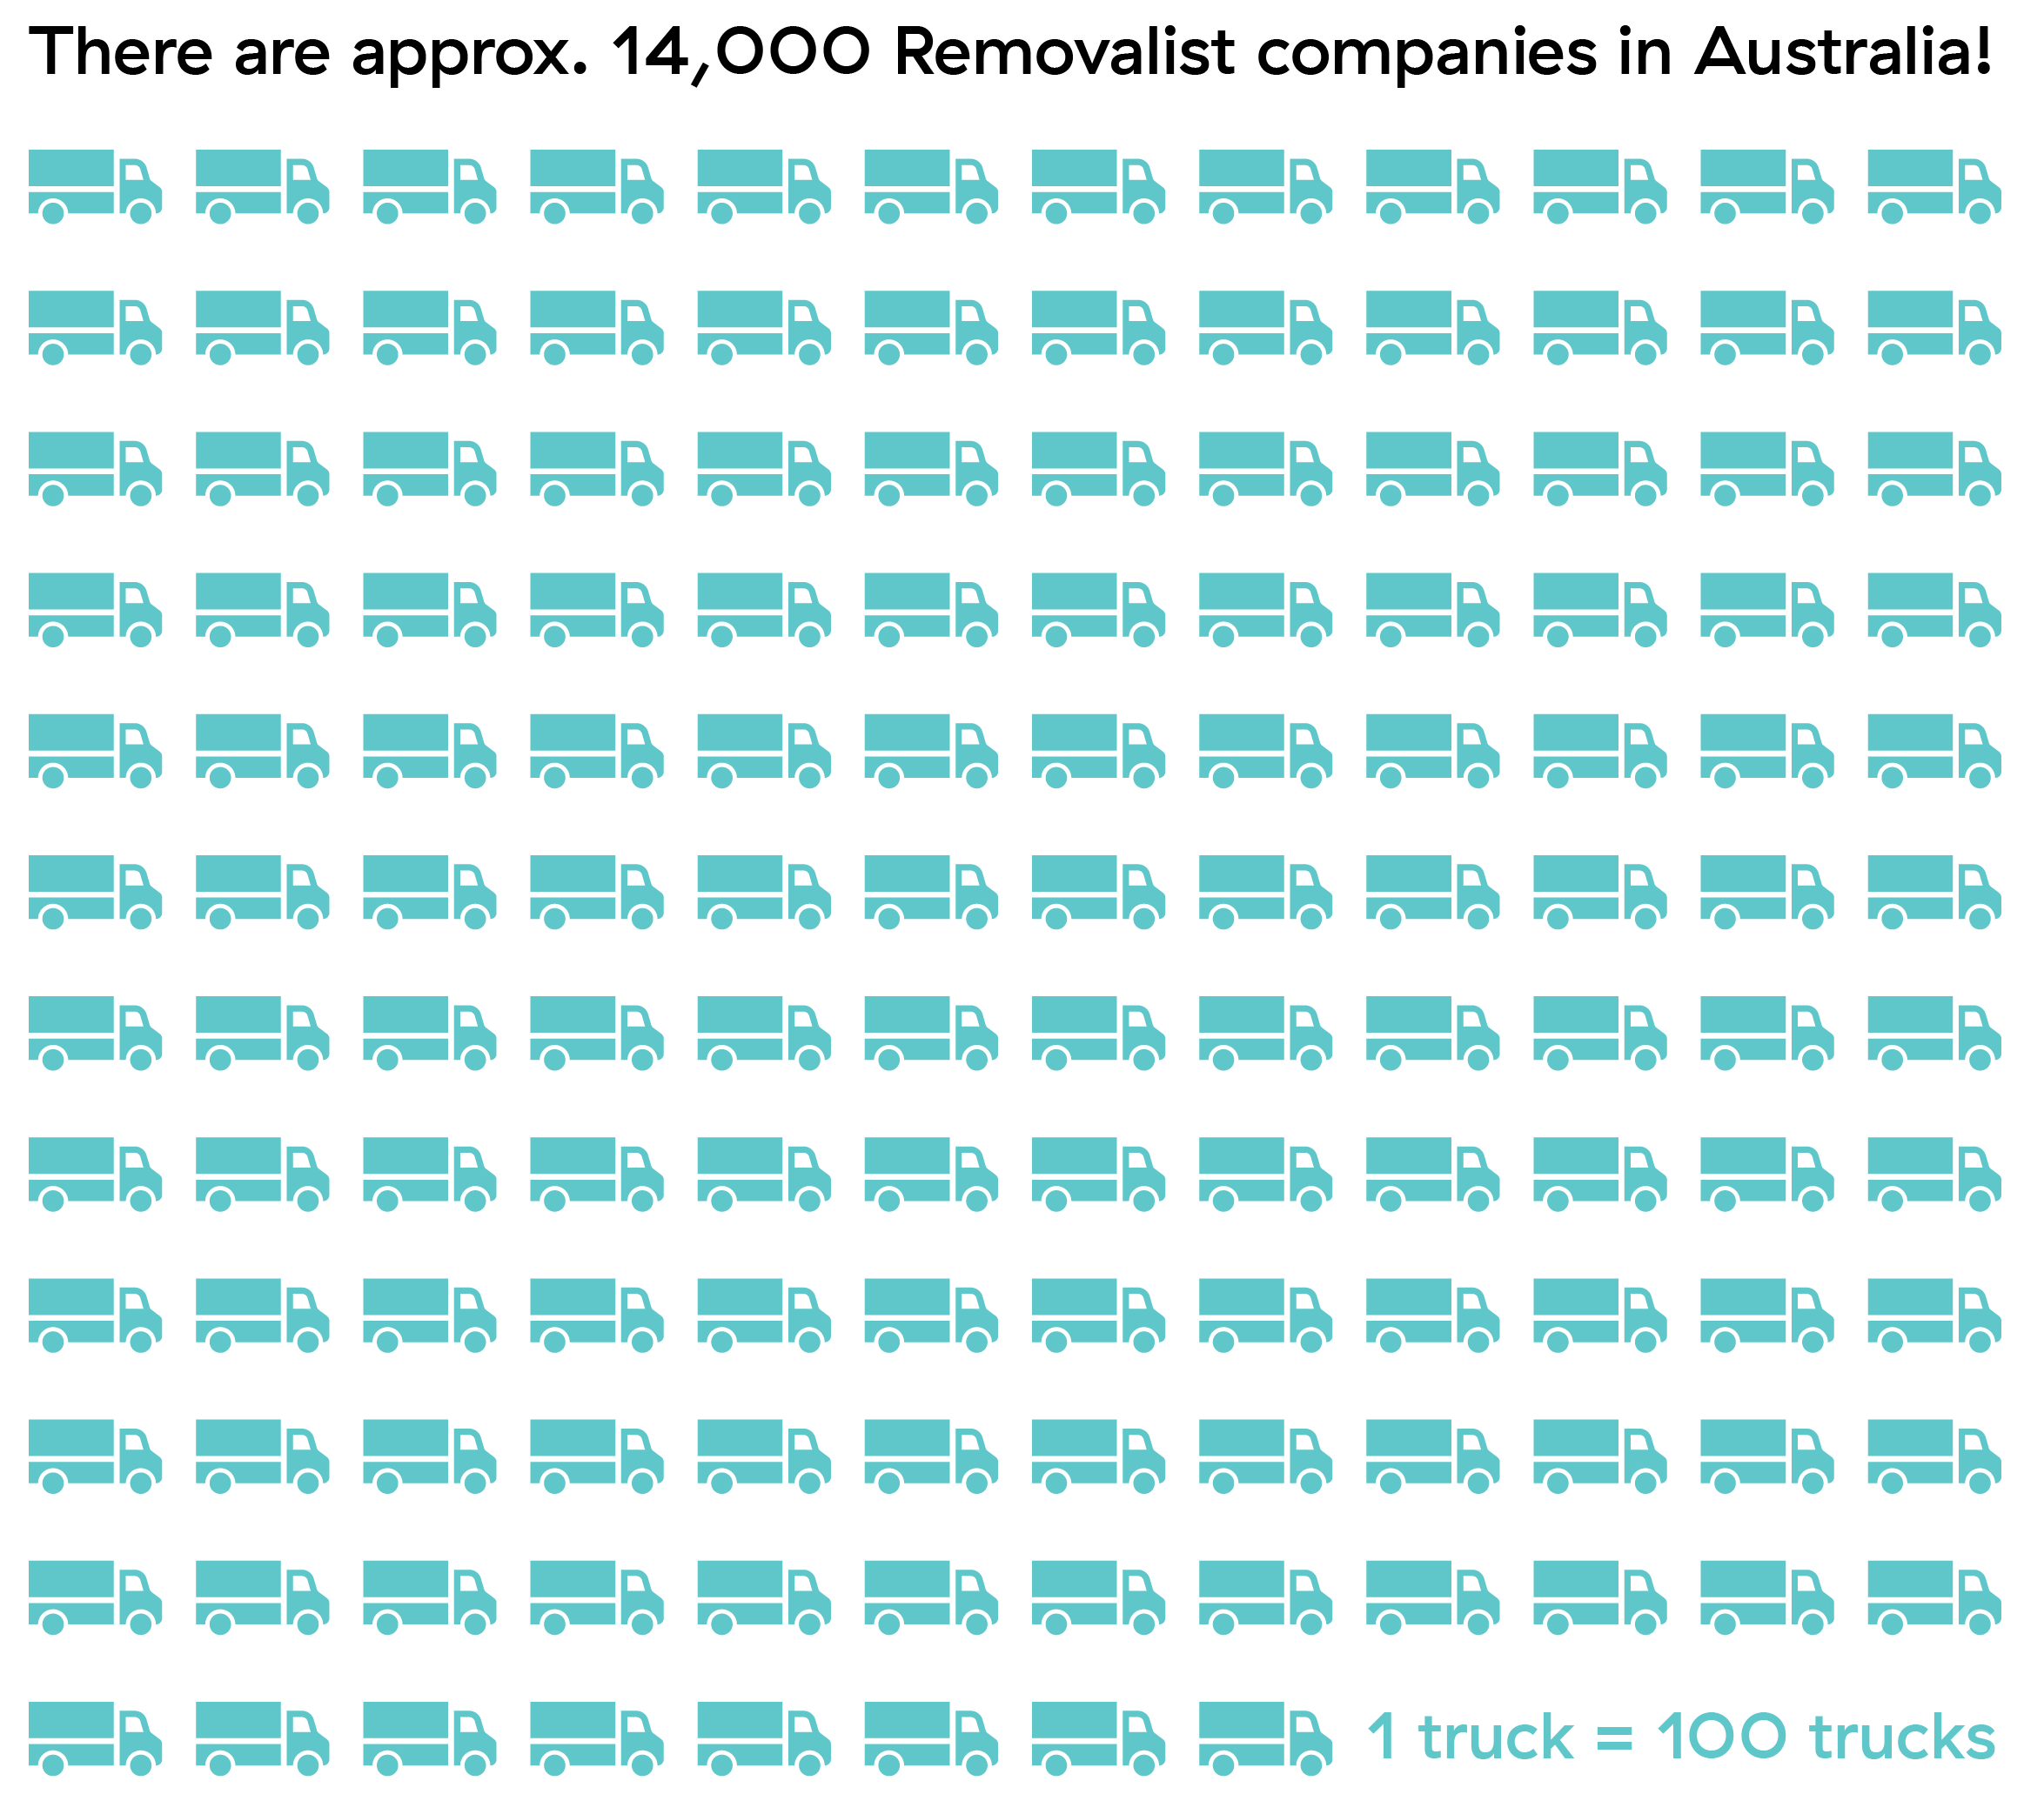
- There are approximately 14,000 removalist companies in Australia
- The Australian removalist industry is worth $2 billion AUD annually
- 45% of the Australian moving industry’s income can be attributed to interstate and long-distance transport, while 29% is from local moving
- The biggest expense within moving companies can be attributed to wages ($1.2b AUD of $2b AUD).
Australia's Migration Trends By State
Looking at Australian migration statistics on a state by state basis, significant insight can be made into the shifting popularity of a number of areas within the country.
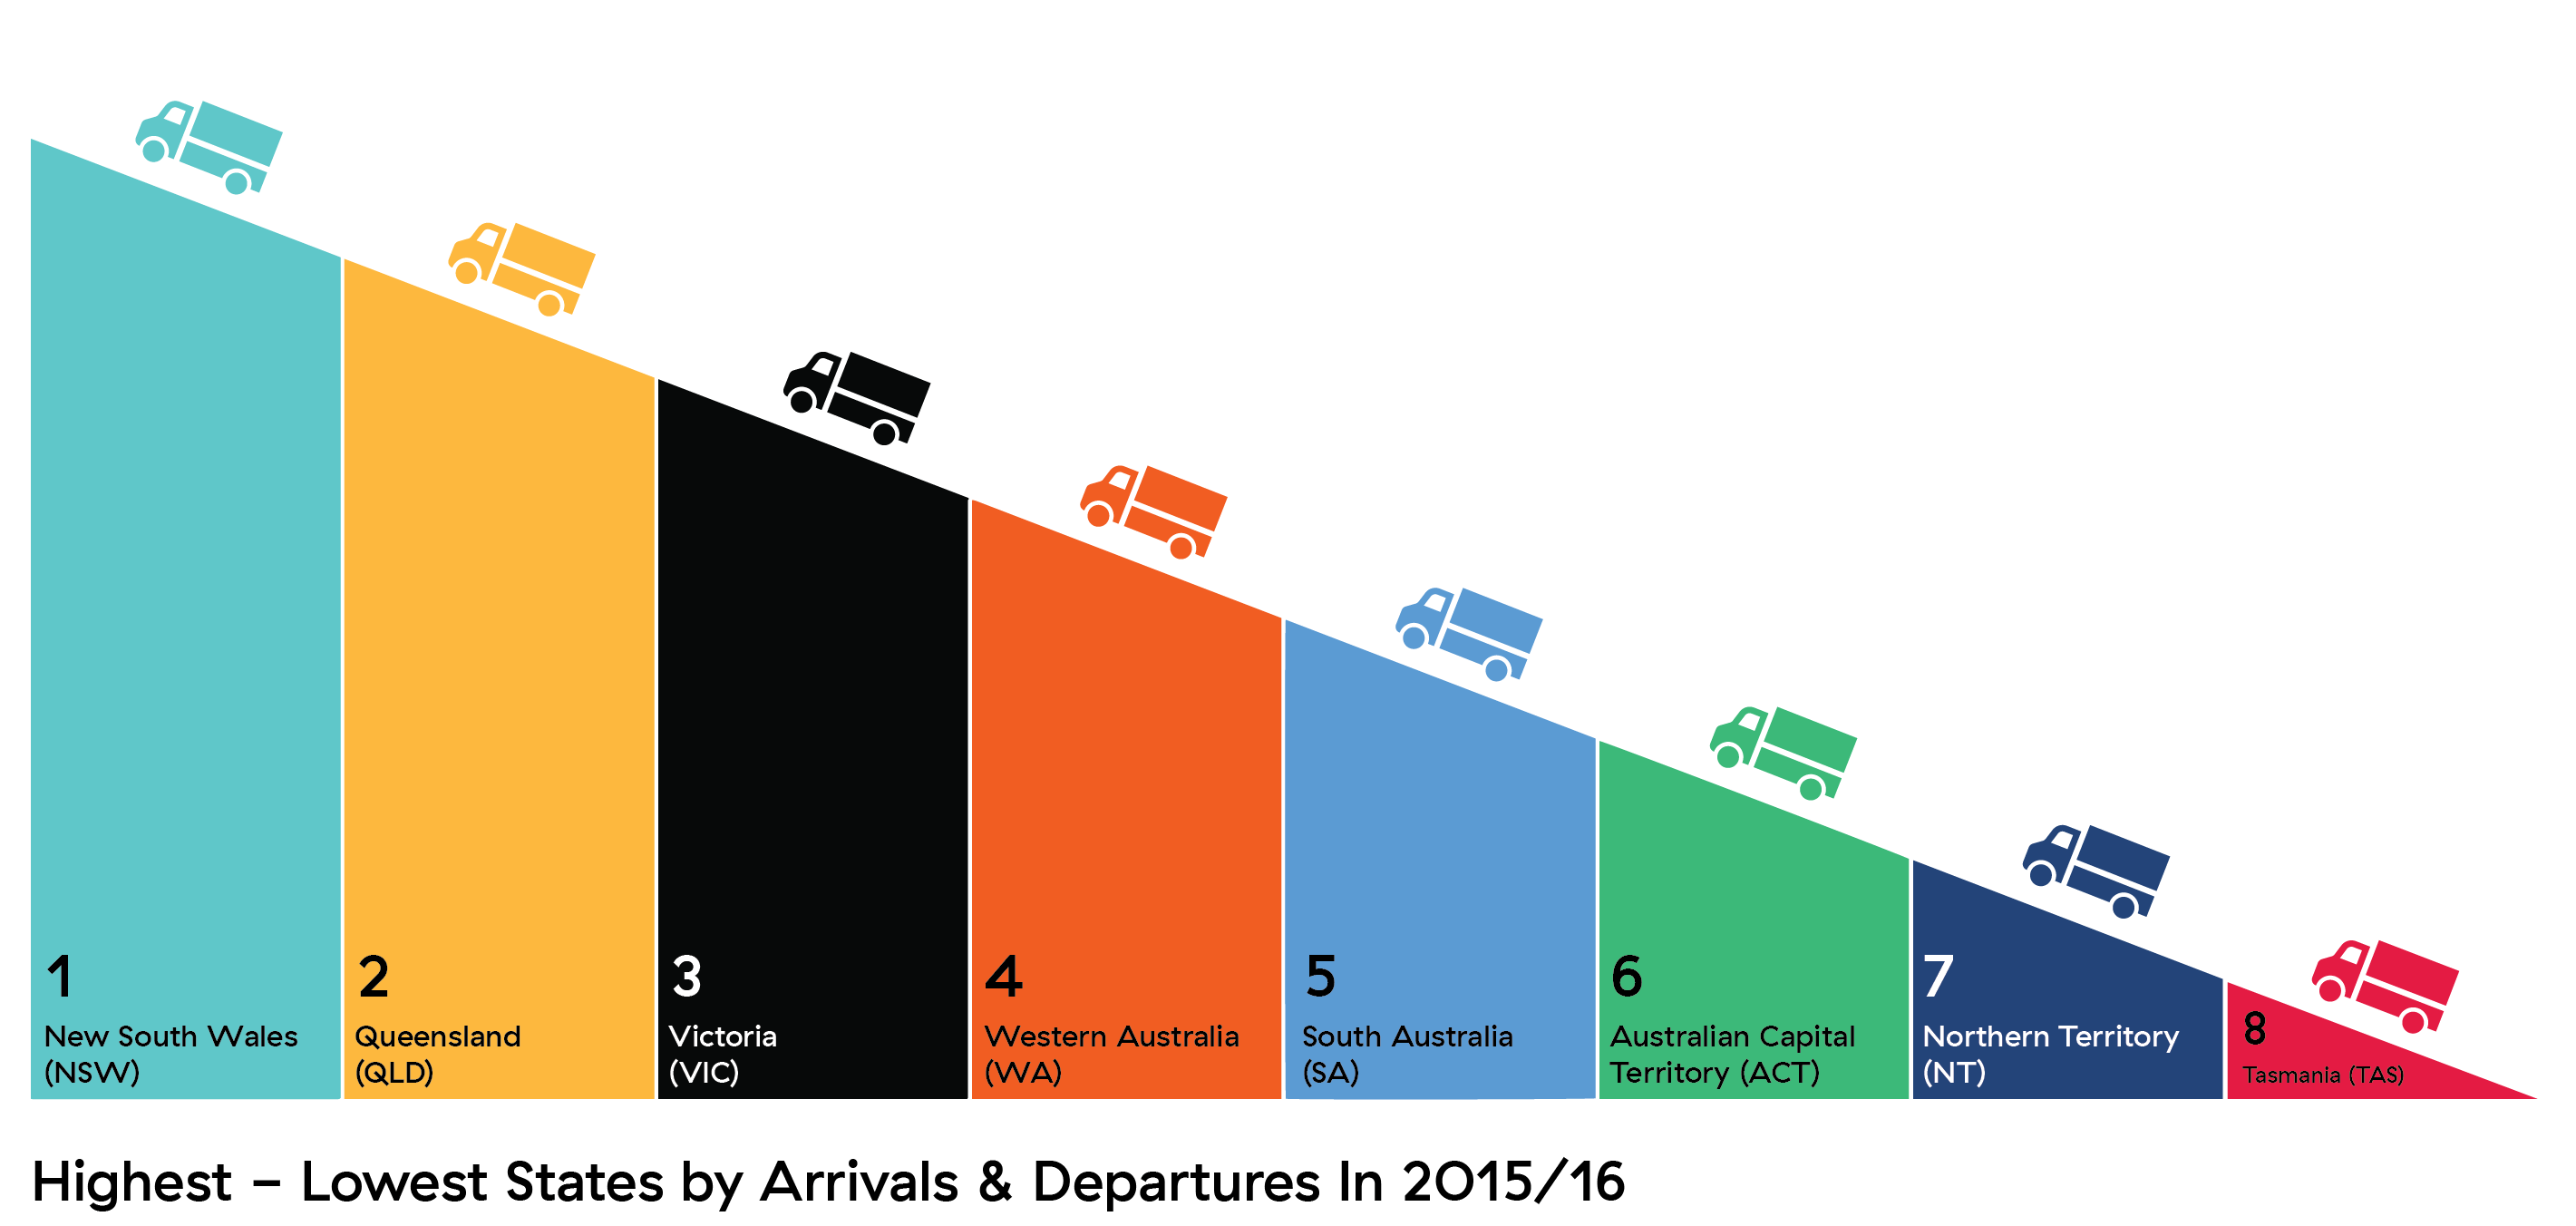
Highest - Lowest States by Arrivals and Departures in 2015-16
Here are the Australian states ranked from highest to lowest regarding internal migration arrivals and departures - evidently, NSW sees the most traffic in and out of the state, whilst TAS sees the least.
- NSW
- QLD
- VIC
- WA
- SA
- ACT
- NT
- TAS
Changes in State Population due to Internal Migration 2018-19
- QLD: 22,831
- VIC: 12,198
- TAS: 2,008
- ACT: -194
- SA: -3,958
- NT: -4,371
- WA: -6,451
- NSW: -22,063
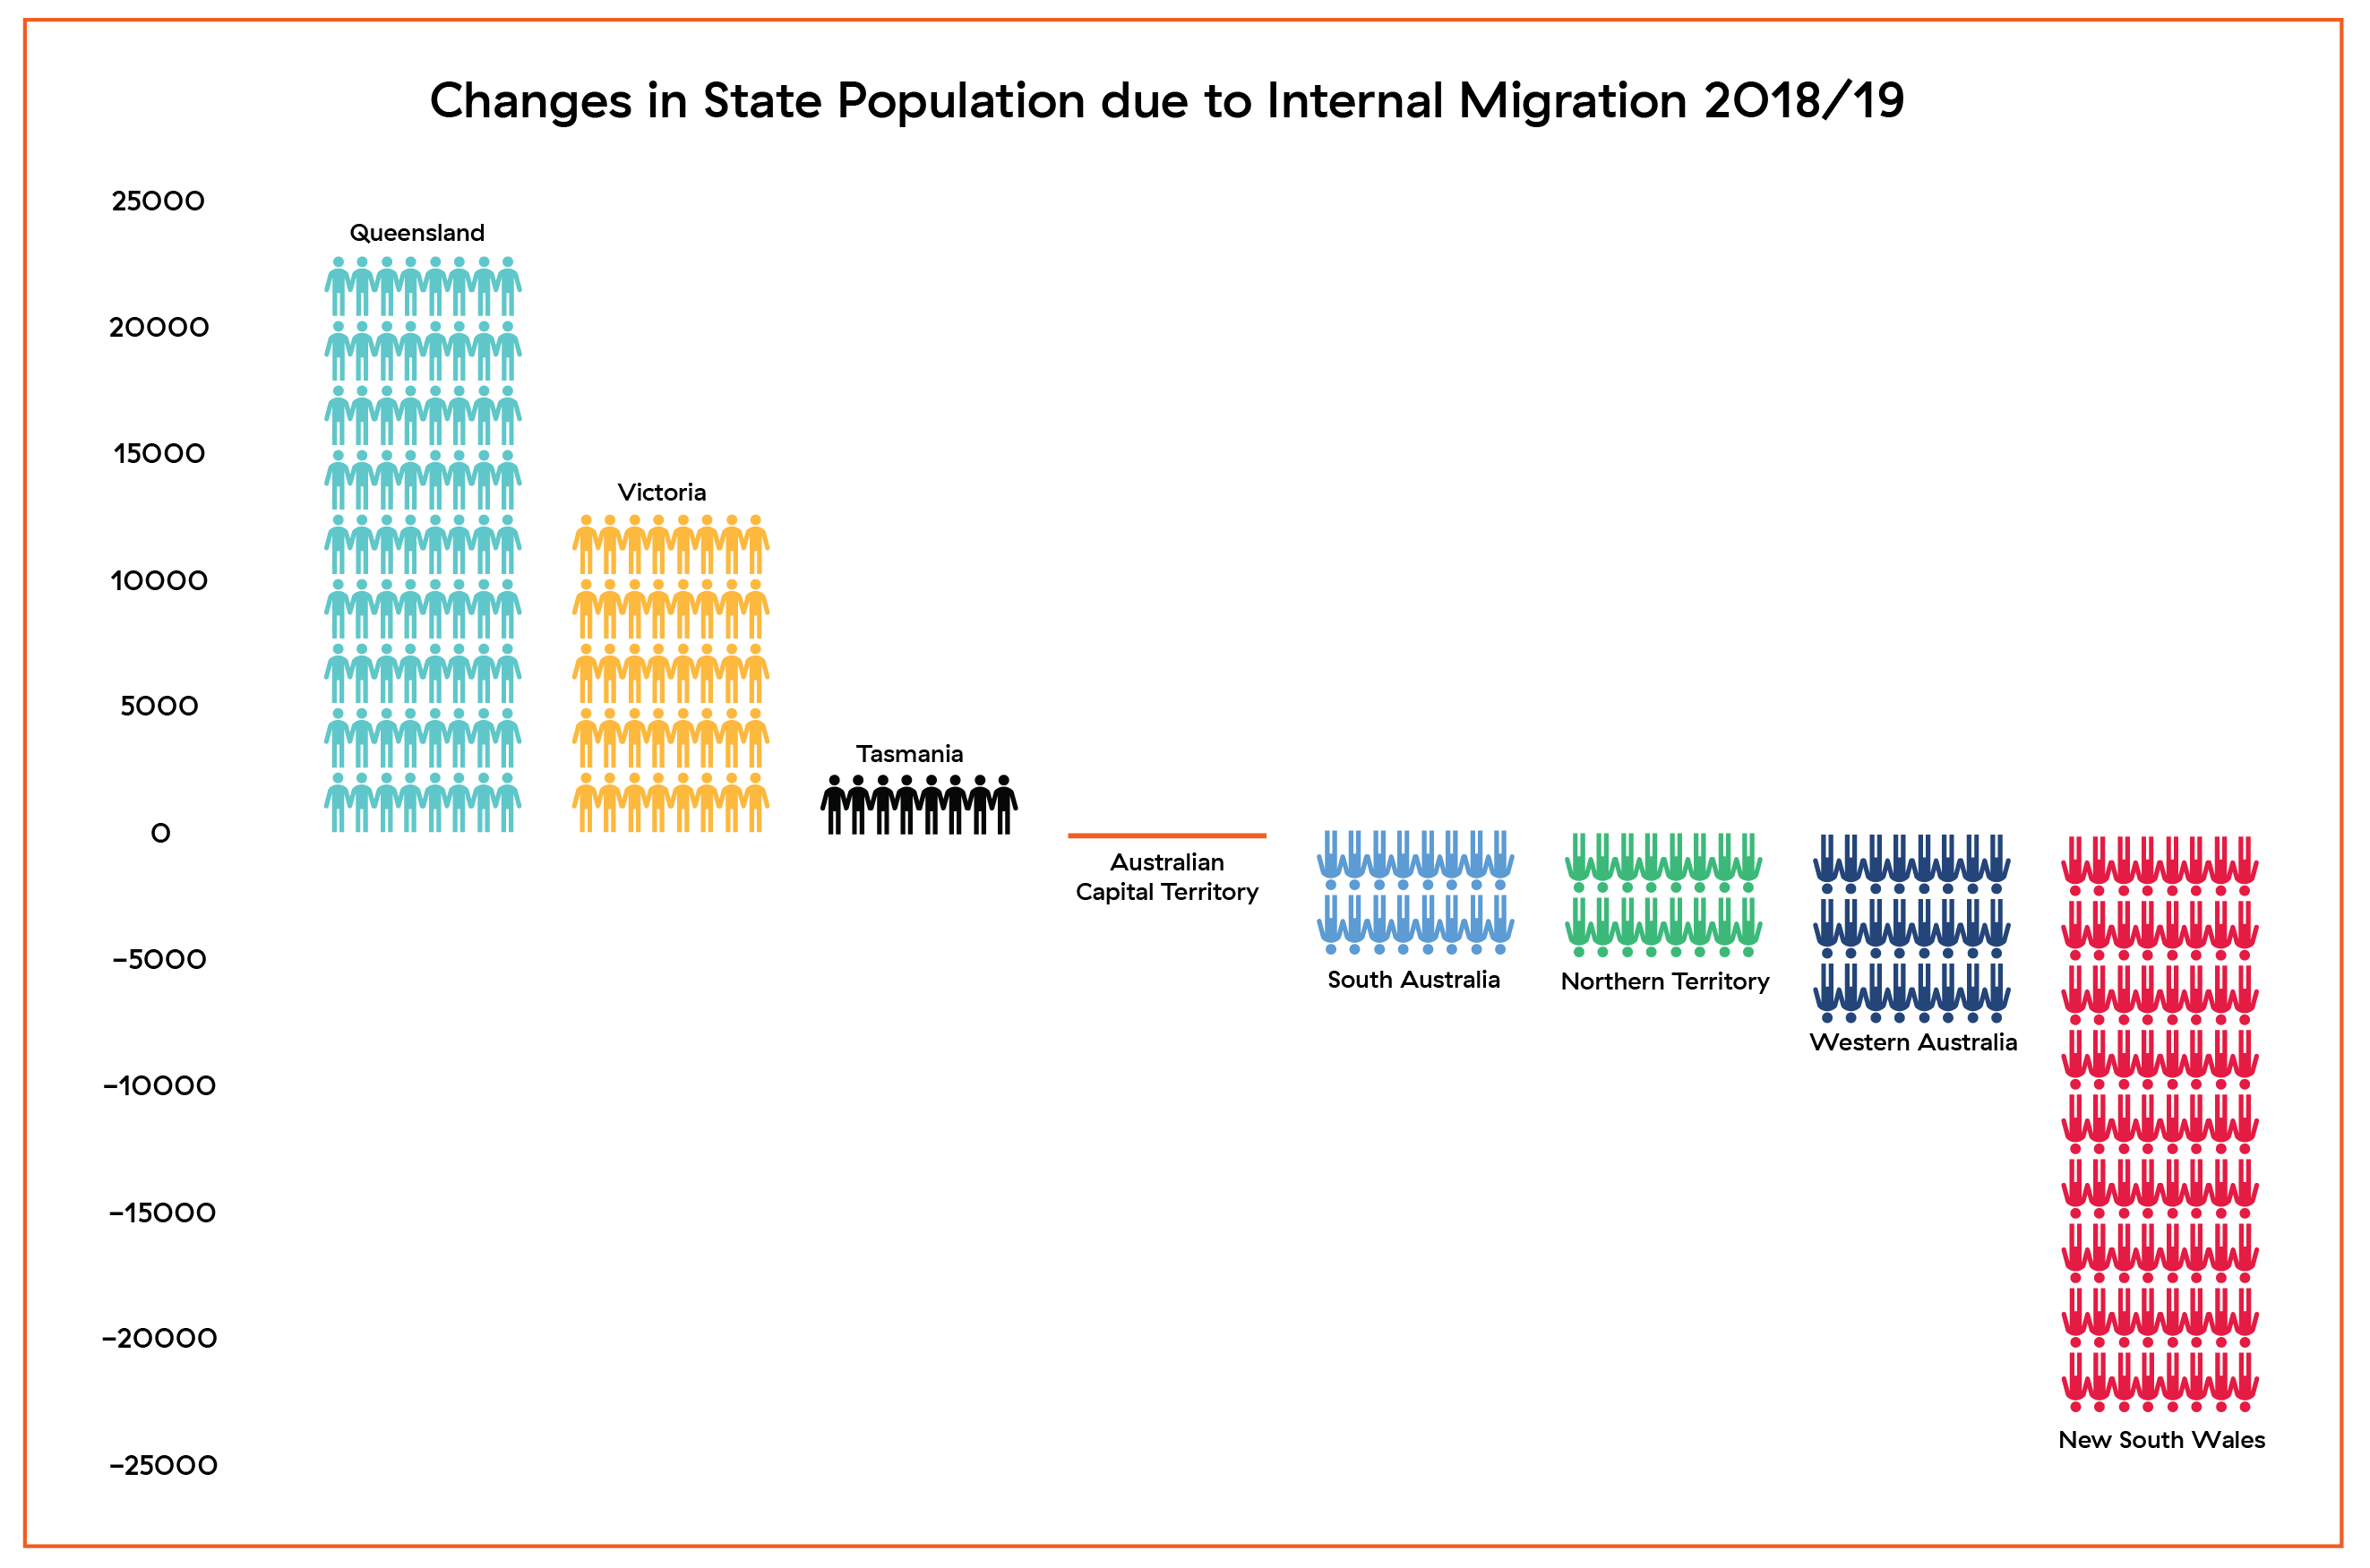
The most popular migration is evident in relocating to Brisbane and other areas in QLD. Based on this data, approximately 75% of NSW leavers are headed to QLD, with the majority of the remainder moving to VIC.
Australian Migration Statistics and Figures By Capital City
Interestingly, whilst Sydney records the highest population losses due to internal migration, the city records the second highest population growth amongst Australian capital cities, due to natural population growth and overseas migration.
Changes in Overall Population by Capital City
- Melbourne: +113,500
- Sydney: +87,100
- Brisbane: +52,600
- Perth: +27,400
- Adelaide: +13,900
- Canberra: +6,300
- Hobart: +3,400
- Darwin: -1,100
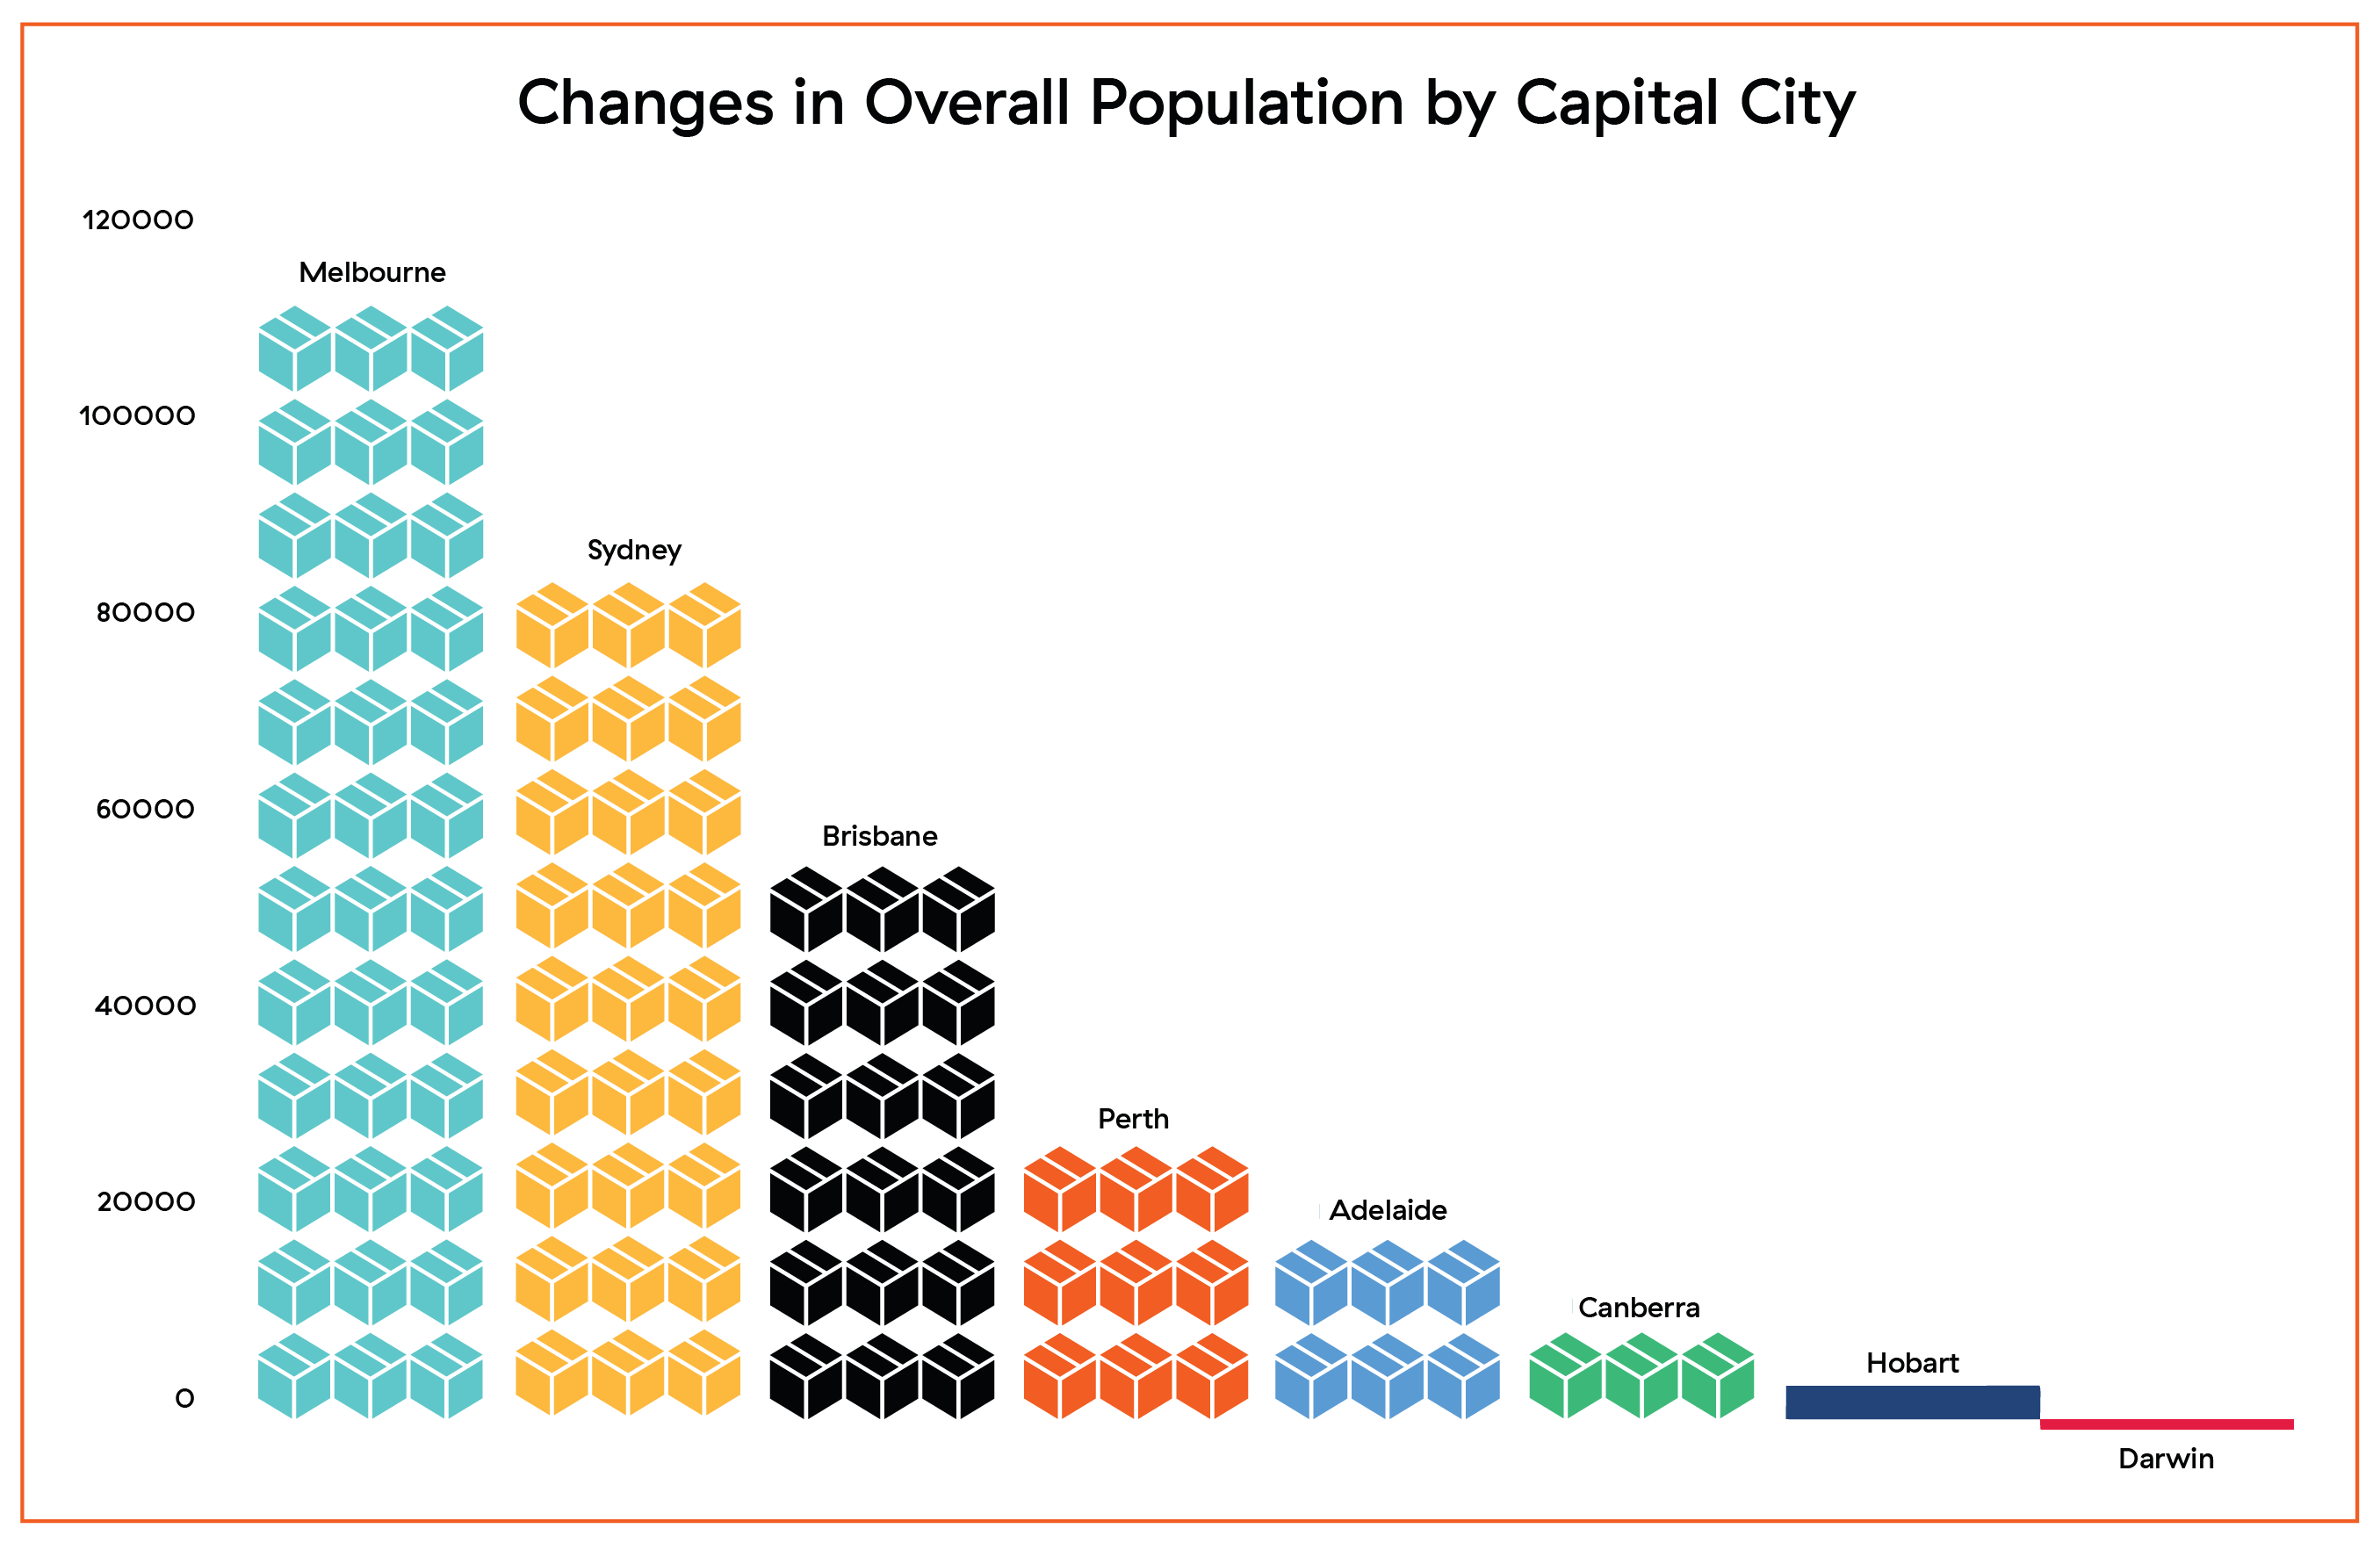
Evidently, the only capital city in Australia to see a decrease in population between 2018-19 was Darwin, where outbound internal migration outweighed both natural population growth and overseas migration.
Destinations of Sydney Departures, 2018-19
The largest group of outbound movers within Australia are leaving Sydney - here are the most popular destinations of Sydney's outbound movers.
- Central Coast: 3,678
- Gold Coast: 3,136
- Mid North Coast: 2,192
- Southern Highlands and Shoalhaven: 2,156
- Newcastle and Lake Macquarie: 1,704
- Sunshine Coast: 1,683
- Hunter Valley (excluding Newcastle): 1,682
- Richmond-Tweed: 1,653
- Illawarra: 1,368
- Inner Melbourne: 1,285
- Capital Region: 1,223
- Central West: 1,180

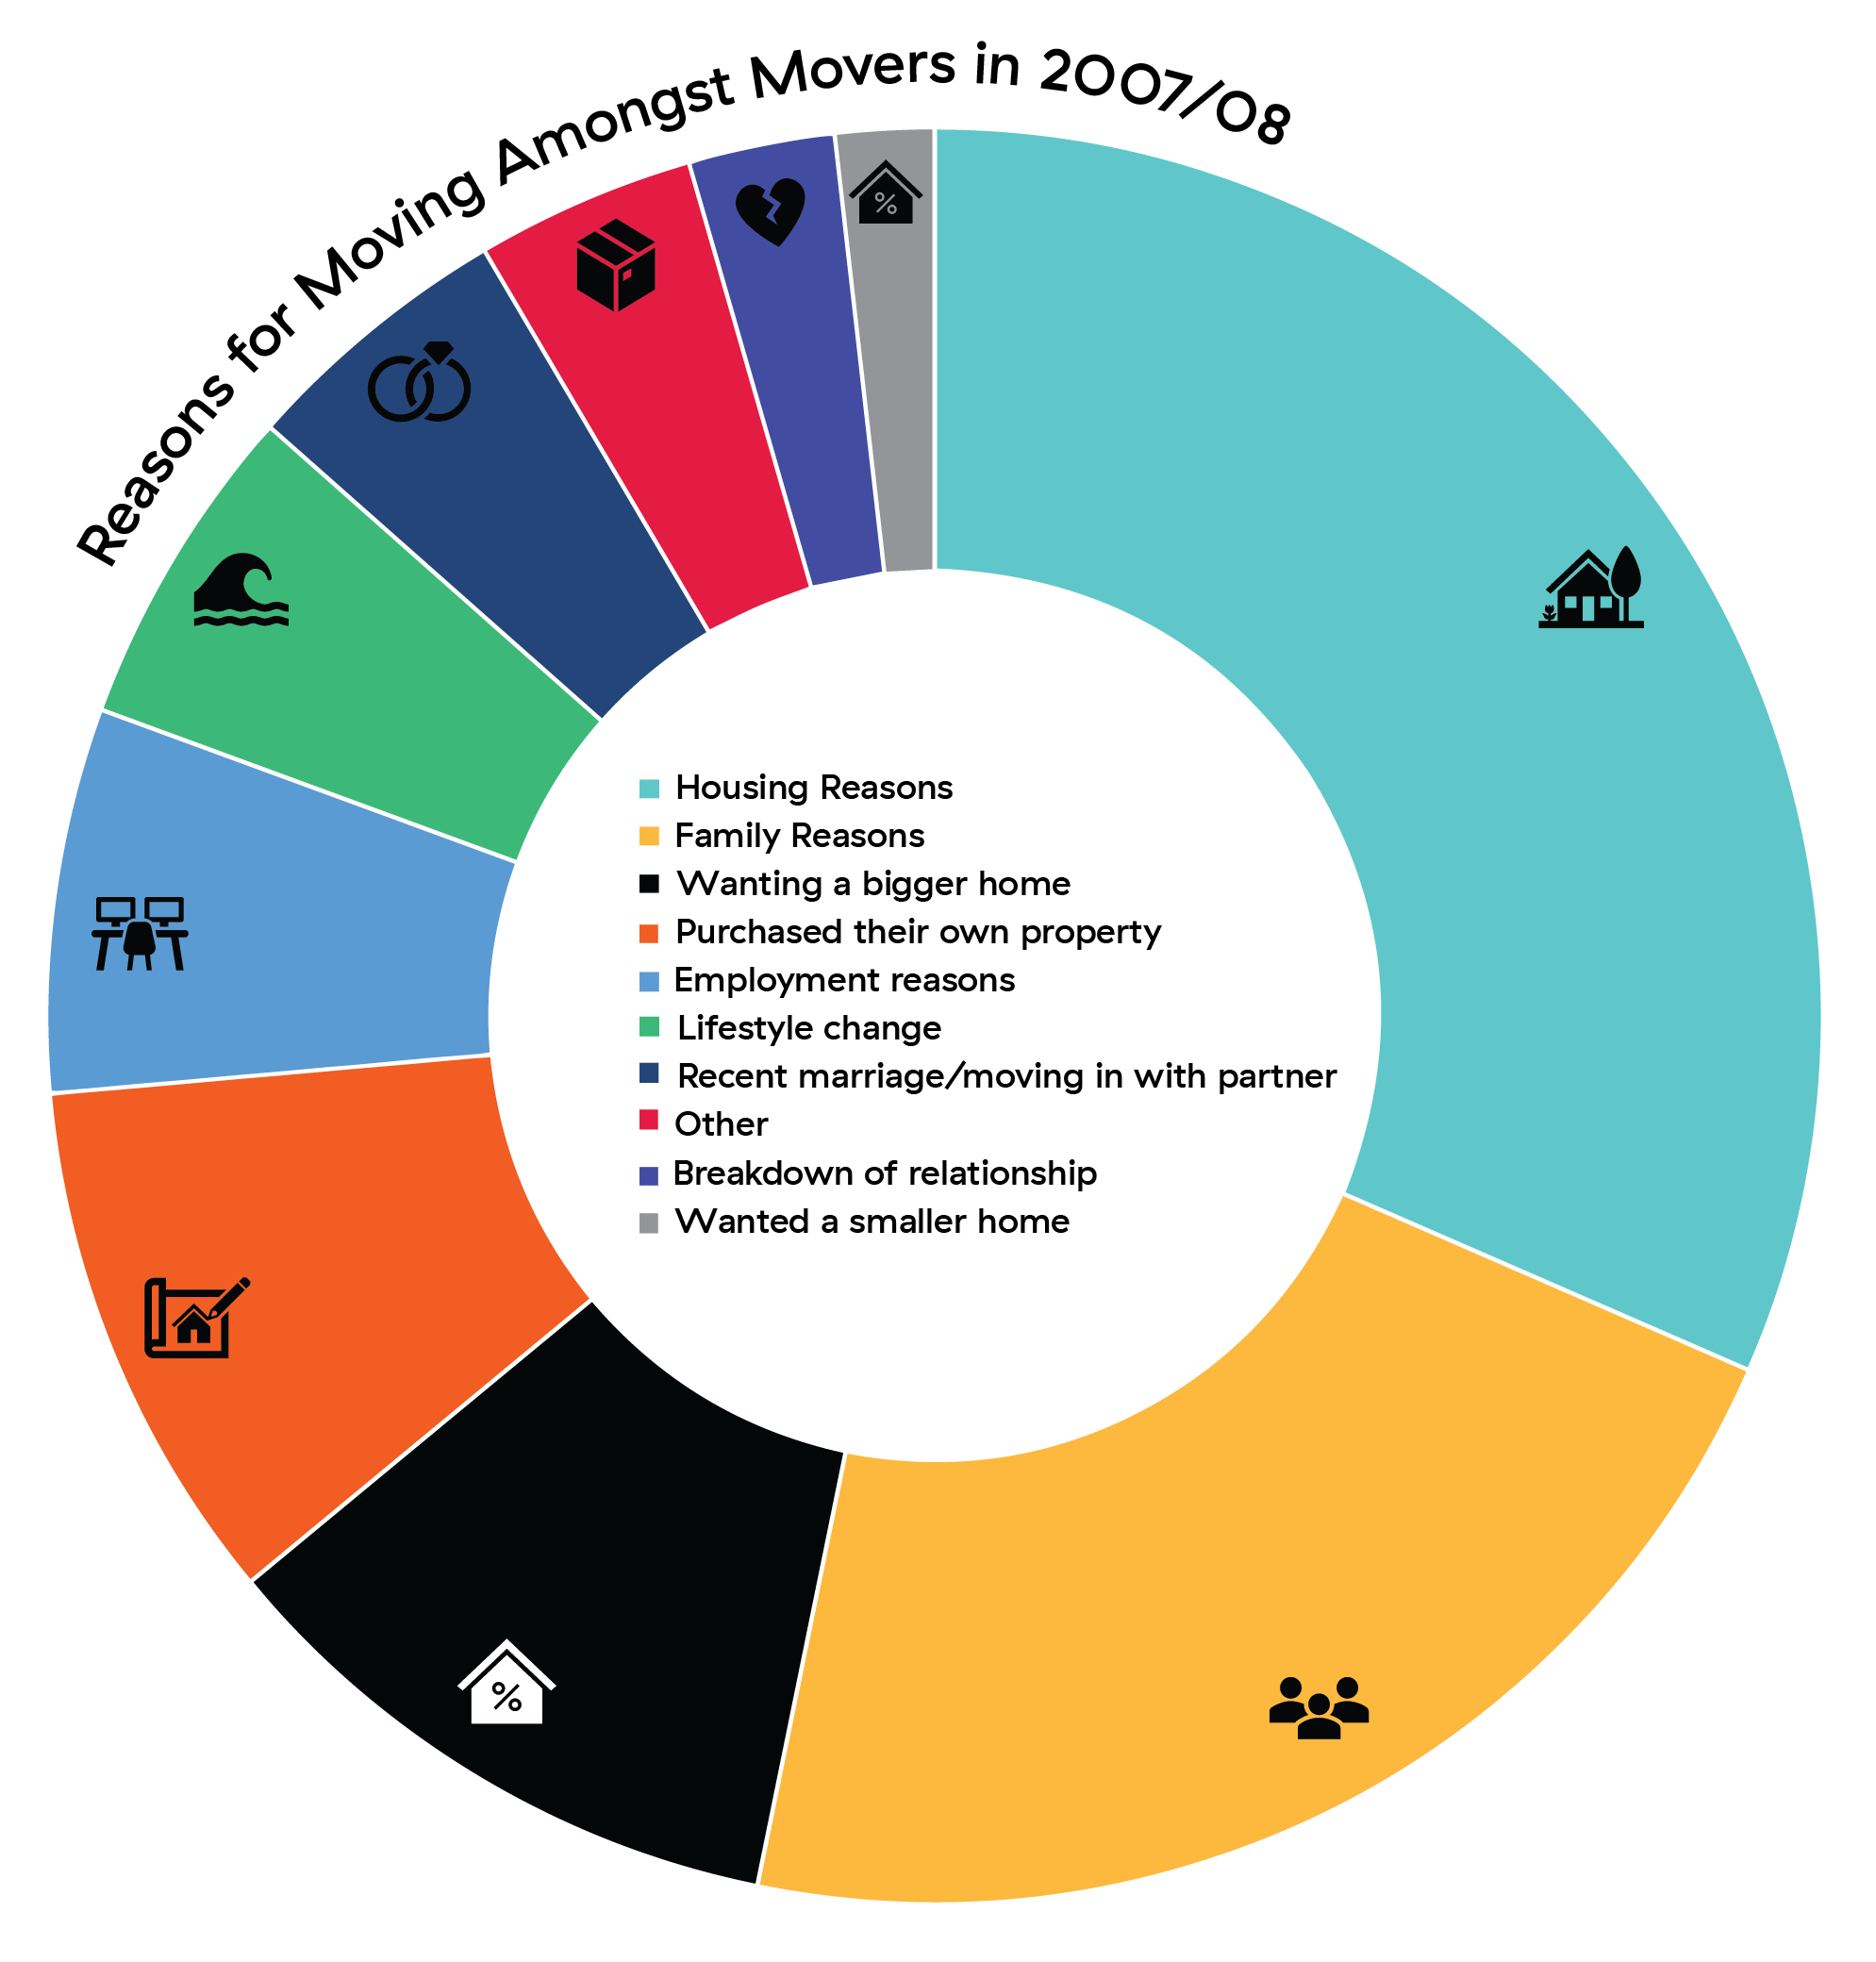
Reasons For Moving Amongst Movers in 2007-08
When it comes to the reasons why people had moved in 2007-08, the results varied across categories of housing, employment, family, lifestyle and other. In addition, these results saw further variation based on the age and position within life of each person. Overall, these are the main reasons for moving more generally:
- Housing reasons: 47.3%
- Wanting a bigger home: 16.2%
- Purchased their own property: 14.4%
- Wanted a smaller home: 2.7%
- Employment reasons: 10.5%
- Family reasons: 32.5%
- Recent marriage/moving in with partner: 7.5%
- Breakdown of relationship: 4.0%
- Lifestyle change: 8.9%
- Other: 6.0%
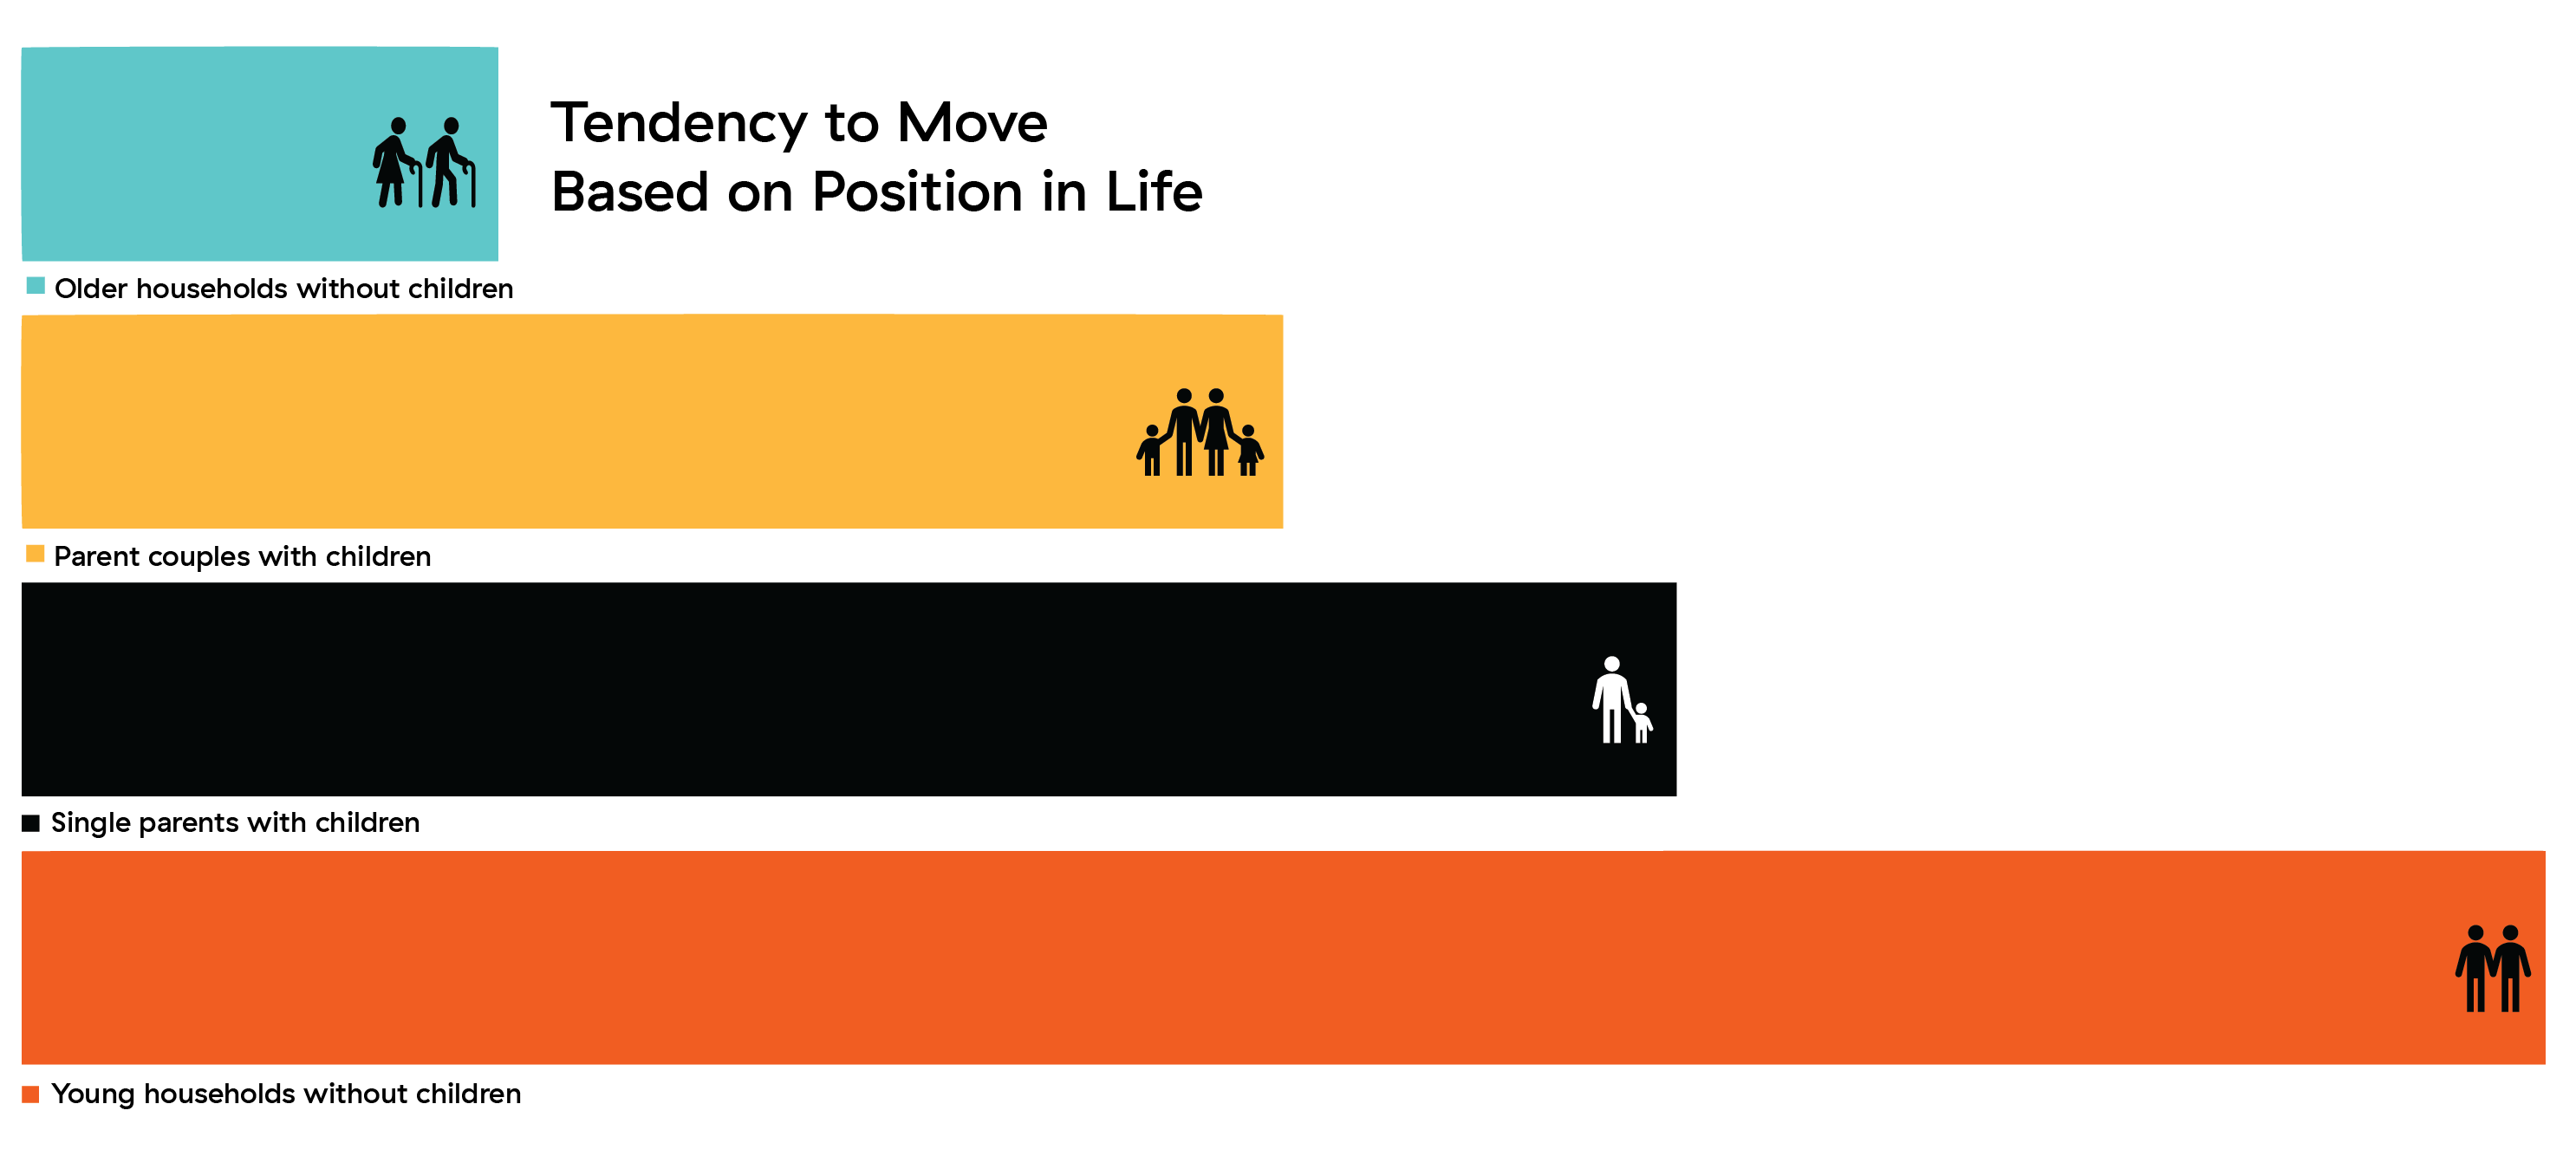
Tendency to Move Based on Position in Life
- Young households without children: 90%
- Single parents with children: 59%
- Parent couples with children: 45%
- Older households without children: 17%
Australian Population by Country of Birth
In 2019, every country in the world was present within the Australian population. Notable insights include:
- England represented the largest overseas group within the Australian population, at 986,000.
- The second largest overseas group within the Australian population was China, at 677,000.
- The third largest overseas group within the Australian population was India, at 660,000.
- The number of Australian born people within Australia was 17.8 million, a figure which saw an increase of 186,000 throughout 2019.
Relocation and Global Moving Trends
- On average, an American will move almost 12 times throughout their life.
- Overall, US moving rates are declining - around 50% as many people move on a yearly basis when compared to 1960s moving rates.
- The US moving industry employs approximately 122,600 people.
- In 2018, the biggest moving day in the US was June 1.
- 83% of moving Americans move within the same state.
- It is estimated that there are approximately 50,000 moving trucks within the US.
References
- Capuano, G., 2020. Migration within Australia – strongest out of Sydney. [online] .id blog. Available at: <https://blog.id.com.au/2020/population/population-trends/migration-within-australia-strongest-out-of-sydney>.
- Simon-Davies, J., 2018. Population and migration statistics in Australia. [online] Aph.gov.au. Available at: <https://www.aph.gov.au/About_Parliament/Parliamentary_Departments/Parliamentary_Library/pubs/rp/rp1819/Quick_Guides/PopulationStatistics>.
- Homeaffairs.gov.au. 2020. 2019-20 Migration Program Report. [online] Available at: <https://www.homeaffairs.gov.au/research-and-stats/files/report-migration-program-2019-20.pdf>.
- Australian Bureau of Statistics. 2021. Regional internal migration estimates, provisional, September 2020. [online] Available at: <https://www.abs.gov.au/statistics/people/population/regional-internal-migration-estimates-provisional/latest-release>.
- Wood, T., 2020. 29+ Moving Industry Statistics [Updated 2021] | moveBuddha. [online] moveBuddha. Available at: <https://www.movebuddha.com/blog/moving-industry-statistics>.
- Bernard, A. and V. Kalemba, S., 2020. Australians are moving home less. Why? And does it matter?. [online] The Conversation. Available at: <https://theconversation.com/australians-are-moving-home-less-why-and-does-it-matter-133767>.
- Kelly, A. 2020. Removalists in Australia. IBISWorld.
Share this page on Facebook
Moving house starts here
View pricing, read reviews and book professional interstate and local removalists online.