The Muval Family Relocation Report

From coastal towns to bustling outer suburbs, Aussie families are on the move. Whether it’s for more space, a better lifestyle, affordability, or proximity to good schools, thousands of families are trading in old postcodes for new ones that better suit their needs. And with the help of our interstate removalists, many are making big moves across state lines to find their ideal home.
But where in Australia are Aussies moving to? And what are the characteristics of their new homes?
In this report, we dive into over six years of Muval data on where over 41,000 families across Australia have moved to and from, uncovering the most popular regions for relocations. We also explore the property types and features topping their wish‑lists — from bigger backyards to home offices and everything in between.
Executive Summary
- Regional Queensland leads family relocations: For every family moving out, 2.48 are moving in, highlighting a strong preference for coastal and regional living.
- Regional Western Australia and Greater Perth are also popular: Inbound-to-outbound ratios of 2.15 and 1.88, respectively, indicate significant family migration to these areas.
- Greater Sydney experiences the highest family exodus: With a ratio of 0.31, more than three families leave for every one that arrives, likely due to high living costs and congestion.
- Australian Capital Territory sees a net loss of families: An inbound-to-outbound ratio below 0.5 suggests families are relocating elsewhere, possibly due to housing costs and limited stock.
- Families prioritize lifestyle and affordability: Moves are driven by desires for more space, better lifestyles, and proximity to good schools, with many opting for regions offering these benefits.
- Data based on over 41,000 family moves (2018–2025): The report analyzes six years of Muval data to uncover migration trends and family relocation preferences across Australia.
Family migration by state
To understand which areas are gaining or losing families, we’ve used an Inbound to Outbound Ratio. A ratio of one means the same number of people arriving and leaving. A ratio below one means more people are moving out than in, while a ratio above one means more families are moving into the area than leaving. For example, a ratio of 2 means there are two inbound moves for every one outbound move, showing the area is clearly in demand.
| Greater Capital City Statistical Areas | Inbound → Outbound Ratio |
|---|---|
| Rest of QLD | 2.48 |
| Rest of WA | 2.15 |
| Greater Perth | 1.88 |
| Rest of TAS | 1.69 |
| Rest of VIC | 1.57 |
| Greater Brisbane | 1.38 |
| Rest of SA | 1.36 |
| Rest of NSW | 1.34 |
| Greater Hobart | 1.28 |
| Greater Adelaide | 1.08 |
| Greater Melbourne | 0.62 |
| Australian Capital Territory | 0.46 |
| Greater Sydney | 0.31 |
When comparing capital cities and rest‑of‑state areas across Australia, regional Queensland (outside Greater Brisbane) stands out as the most popular spot for family relocations. For every one family who moved out, 2.48 moved in — suggesting a strong shift towards coastal and regional living. With its mix of lifestyle‑friendly towns, warmer weather, lower property prices, and access to nature, it’s no surprise that families are flocking north for a more relaxed and affordable way of life.
Regional Western Australia (outside of Perth) is close behind, with a ratio of 2.15 inbound moves for every outbound. Families could be drawn to WA’s wide‑open spaces, strong employment opportunities in mining and infrastructure, and slower pace of life, without compromising on natural beauty or lifestyle perks. Greater Perth also makes the top three, with a healthy 1.88 ratio, indicating that the capital is still attracting families with its relatively affordable housing market, strong job market, and access to beaches, schools, and amenities.
At the other end of the spectrum, Greater Sydney has experienced the highest loss of families, with a ratio of just 0.31, meaning that for every family that moved in, more than three have moved out. This may reflect the city’s soaring cost of living, rising property prices, and a growing desire among families for more space and less congestion. The ACT follows, with an inbound‑to‑outbound ratio below 0.5. While Canberra offers great schools and career opportunities, the high cost of housing and limited stock may be prompting families to look elsewhere.
So, where are the families leaving places like Sydney and the ACT going instead? And where are those flocking to regional Queensland and WA coming from? Let’s take a closer look at the migration patterns driving these moves.
Where are families from Greater Sydney moving to?
One in five (20%) of families relocated from Sydney to regional New South Wales, trading city life for a quieter, more spacious and affordable lifestyle — but not everyone is heading for regional areas. A significant share opted for major cities, with 19.6% of moves from Greater Sydney going to Greater Melbourne, and 19% heading to Greater Brisbane. These capital cities may offer a more affordable cost of living while still delivering the buzz of city life, making them attractive alternatives for families looking to stretch their budgets without giving up urban convenience.
Where are families from the Australian Capital Territory moving to?
Almost a quarter (23.8%) of families relocating from the ACT moved to Greater Brisbane, making it the top destination for ACT movers. Many are likely drawn by the warmer weather, more affordable living costs, and growing job opportunities. Greater Melbourne comes in second at 17.8%, significantly higher than the 10.4% who chose to move to Greater Sydney. Regional NSW takes third place, attracting 17.1% of ACT families — perhaps offering a balance between lifestyle, affordability, and proximity to Canberra.
Where are families from Greater Melbourne moving to?
For families leaving Greater Melbourne, the top destinations were split evenly between staying closer to home or heading north. Regional Victoria and Greater Brisbane tied for the top spot, with 18.3% of family movers choosing each. Regional Queensland wasn’t far behind, attracting 17.4% of movers. These top three destinations significantly outpaced Greater Sydney, which ranked fourth with just 11.1%, suggesting that affordability continues to steer families away from Australia’s most expensive city.
Where are families moving to Queensland coming from?
Unsurprisingly, Greater Brisbane accounts for the highest number of families relocating to regional Queensland, with one in four (25%) making the move from the city to more laid‑back regional areas. This trend likely reflects a growing desire for more space, a quieter lifestyle, and more affordable property — all while staying within driving distance of Brisbane’s amenities and job opportunities.
Hot on Brisbane’s heels are families from Sydney (22.3%) and Greater Melbourne (21.9%), both showing strong interest in Queensland. With lower living costs, warmer weather, and a strong sense of community, regional Queensland is proving a popular alternative to the big‑city hustle — especially for families looking to balance lifestyle and budget, without sacrificing access to good schools, beaches, and essential services.
Where are families moving to Western Australia coming from?
The majority of family moves to regional Western Australia came from within the state, with 59.8% relocating from Greater Perth, a clear sign that many families are trading city life for a more relaxed, spacious lifestyle without leaving the state. Among interstate movers, Greater Melbourne accounts for 9% of moves, followed by Brisbane and Sydney at 6% each.
In contrast, families relocating into Greater Perth largely arrived from interstate, with 28.5% coming from Melbourne and 24.7% from Sydney. Just 7.1% of family moves into Perth come from regional WA, highlighting how the city is attracting new residents from other major capitals more than from its state.
Family migration by region
The regions with the highest net migration
| Region | Inbound → Outbound Ratio |
|---|---|
| Sunshine Coast QLD | 3.28 |
| Bunbury, WA | 2.89 |
| Mandurah, WA | 2.71 |
| Wide Bay, QLD | 2.71 |
| Western Australia – Wheat Belt | 2.54 |
| Cairns, QLD | 2.19 |
| South East, Tasmania | 2.15 |
| Central Queensland | 2.04 |
| Gold Coast, QLD | 1.99 |
| West & North West, Tasmania | 1.96 |
With regional Queensland leading the way for capital‑city‑to‑regional migration, it’s no surprise that the Sunshine Coast tops the list for family moves, boasting the highest inbound‑to‑outbound ratio in the country. For every family that leaves the region, 3.28 move in.
But where are these families coming from? The Sunshine Coast is attracting movers from right across the country. Notably, 7% of family moves to the region come from Brisbane’s Inner City. There’s also strong interest from interstate, with 4.8% of moves coming from the ACT, another 4.8% from Inner Melbourne, 4.6% from Melbourne’s Inner South, and 4.4% from North Brisbane. These trends highlight how families are drawn to the Sunshine Coast for its balance of lifestyle, affordability, space, and year‑round sunshine.
The regions with the highest net‑negative family migrations
| Region | Inbound → Outbound Ratio |
|---|---|
| Sydney – City and Inner South | 0.18 |
| Melbourne – Inner | 0.23 |
| Sydney – Eastern Suburbs | 0.32 |
| Sydney – Parramatta | 0.42 |
| Sydney – Inner West | 0.45 |
| Australian Capital Territory | 0.46 |
| Sydney – North Sydney and Hornsby | 0.47 |
| Sydney – Inner South West | 0.52 |
| Sydney – Ryde | 0.52 |
| Sydney – Northern Beaches | 0.59 |
Sydney’s City and Inner South has the lowest inbound‑to‑outbound ratio in the country at 0.18, meaning that for every five families leaving the area, fewer than one family is moving in. A similar pattern can be seen in Melbourne, with Inner Melbourne taking second place with a ratio of 0.23.
For families leaving Sydney’s City and Inner South, the most common destination is Sydney’s Inner West, with one in ten choosing to relocate just a few suburbs away, likely drawn by slightly more space while still staying close to the city. Outside of Greater Sydney, the Gold Coast stands out as the top interstate destination, attracting 3.7% of movers from the City and Inner South.
The rest of the top 10 is dominated by other parts of Greater Sydney, including the Eastern Suburbs, Parramatta, Inner West, North Sydney and Hornsby, Inner South West, Ryde, and the Northern Beaches. The ACT is the only other area outside of Sydney and Melbourne to appear in the top 10, landing in sixth place.
The types of homes Aussie families are moving to
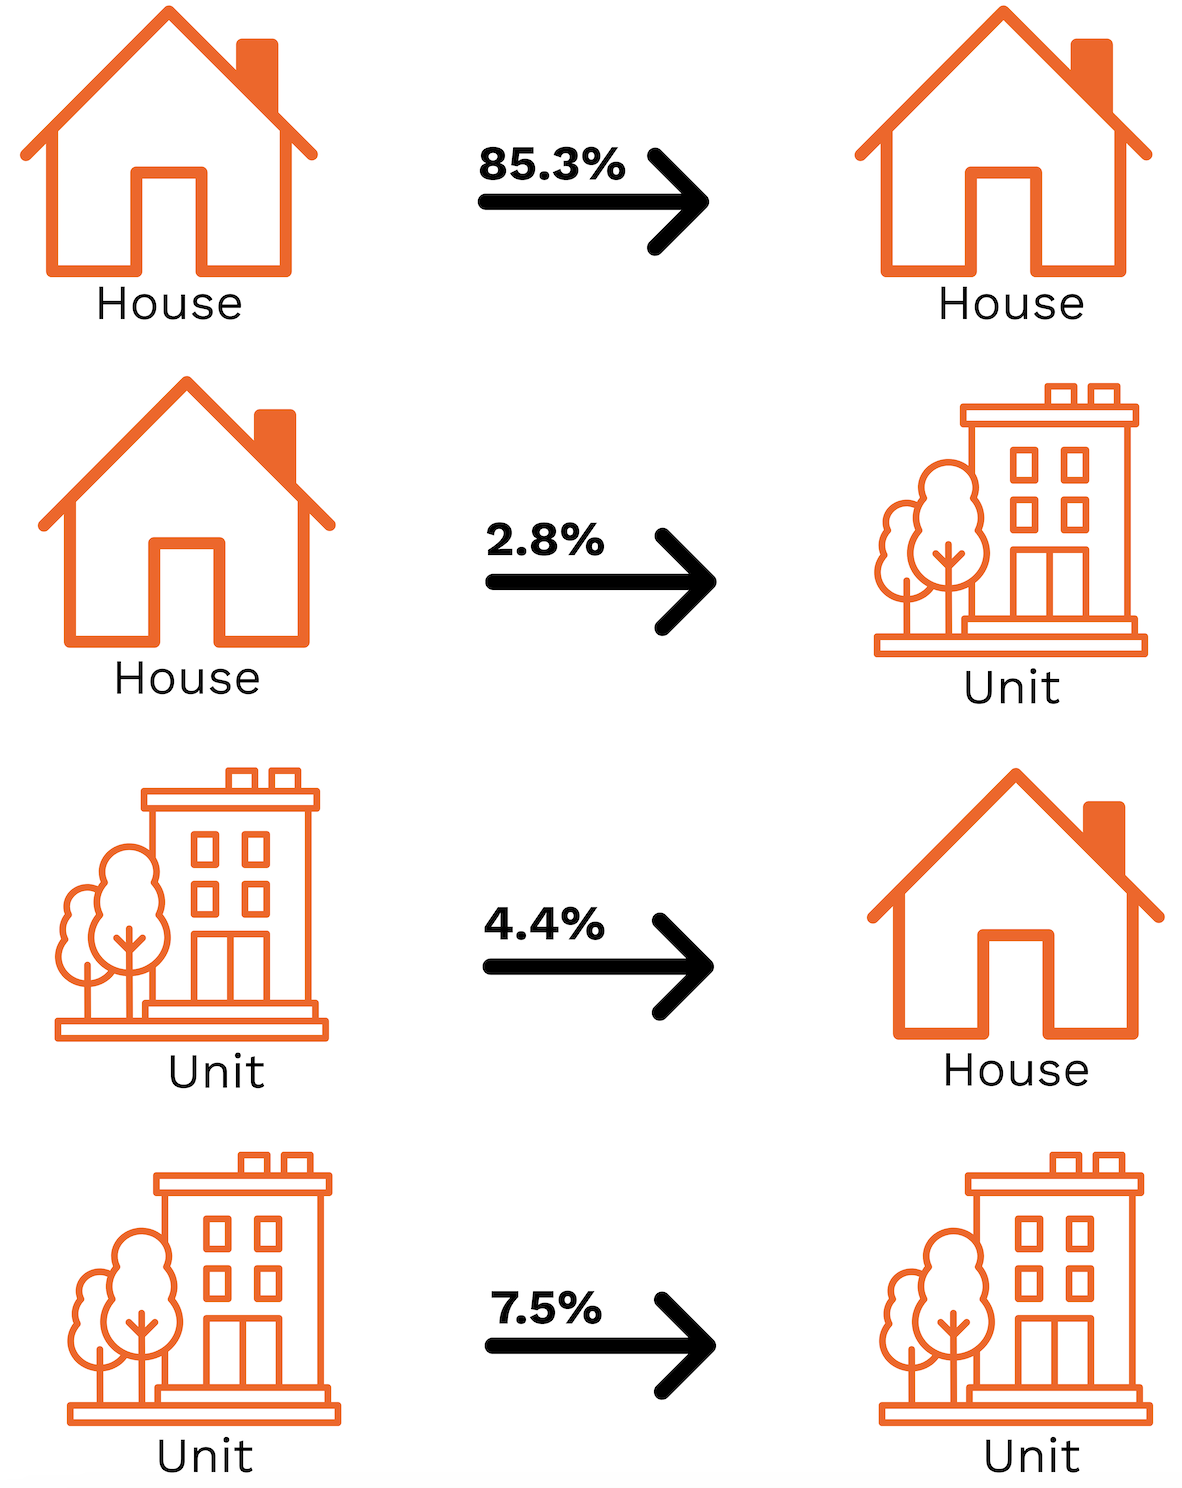
When it comes to family moves, the majority (85.3%) are transitioning from one house to another. Interestingly, around one in ten families are moving into units, with 2.8% downsizing from houses and 7.5% remaining in unit living. With the rising cost of living, this shift may reflect a growing need for more affordable housing options.
This is further supported by the data showing that over one in ten (13.9%) family moves are into smaller homes with fewer bedrooms, while half (50%) are relocating into homes of the same size. Additionally, 14.8% are opting for fewer bathrooms. One in four families are also selling properties valued 20–50% more than the homes they’re moving into — a clear sign that many are making financial trade‑offs to better align with their current budgets or lifestyle needs.
However, it’s not a one‑size‑fits‑all story. While some families are downsizing, others are seizing the opportunity to upgrade. Around 4.4% are moving from units to houses, and over a third (35.7%) are increasing their number of bedrooms. Almost two in five families (37.4%) are upsizing to a home worth at least 20% more — perhaps finally securing the extra space they’ve been dreaming of.
The data also paints a telling picture of the current housing climate. While over half (56.1%) of families are moving between homes they own, a significant 16.8% are shifting from owner‑occupier to renting, nearly three times the number moving in the opposite direction. In fact, just 6.3% of families are making the leap from renting to owning when they move, suggesting that rising property prices and affordability pressures may be putting homeownership further out of reach for many. Meanwhile, one in five (20.8%) of family moves are from one rental to another, pointing to a highly mobile renting population that’s continuing to search for the right fit.
Features of family housing
| Rank | Home Feature | % of Family Homes | % of Non‑Family Homes |
|---|---|---|---|
| 1 | Ensuite | 66.5% | 42.2% |
| 2 | Walk‑in wardrobe | 62.4% | 31.1% |
| 3 | Built‑in wardrobe | 55.2% | 48.9% |
| 4 | Entertainment area | 54.7% | 31.1% |
| 5 | Double garage | 53.3% | 22.2% |
| 6 | Nearby shopping centres | 50.5% | 60.0% |
| 7 | Alfresco | 50.1% | 26.0% |
| 8 | Air conditioning | 49.1% | 33.3% |
| 9 | Close to park | 41.0% | 48.9% |
| 10 | Large backyard | 40.4% | 24.4% |
| 11 | Ducted heating | 37.2% | 24.4% |
| 12 | Solar panels | 32.7% | 11.1% |
| 13 | Garden shed | 25.9% | 17.8% |
| 14 | Swimming pool | 22.4% | 4.4% |
| 15 | Home office | 21.0% | 11.1% |
| 16 | Study | 20.8% | 8.9% |
| 17 | Fenced backyard | 20.6% | 15.6% |
| 18 | Close to schools | 19.2% | 13.3% |
| 19 | Secure parking | 14.1% | 22.2% |
| 20 | Close to university | 12.1% | 17.8% |
When it comes to choosing a new home, families have a clear set of priorities — and they’re all about space, comfort, and features that support busy family life. Top of the wish‑list are ensuite bathrooms (66.5%) and walk‑in wardrobes (62.4%), significantly more important to families than to non‑family households. Built‑in wardrobes, entertainment areas, and double garages also rank highly, with families twice as likely to prioritise double garages and alfresco areas. This highlights their need for functional spaces that work for both everyday routines and social gatherings.
"We’re seeing more and more families downsize, move out of expensive inner‑city areas, or relocate to more affordable parts of the country. In fact, over one in ten family moves are into smaller homes with fewer bedrooms, and one in four are selling properties worth significantly more than the homes they’re moving into."
While non‑family households place more importance on being close to shopping centres (60% vs 50.5%) and parks (48.9% vs 41%), families are more focused on what’s within the home itself. While being close to amenities is also important to families, features like large backyards, air conditioning, and solar panels rank much higher for families than they do for non‑families, suggesting a stronger focus on space, comfort, and long‑term energy efficiency. Families are also more likely to value home offices and studies, a nod to the increasing need for flexible spaces that cater to both work and school from home. However, this could also be due to the disproportionate number of non‑families living in units, which tend to be built in locations near such amenities and have less space for additional features.
James Morrell, Co‑Founder and CEO at Muval, comments:
“We’re seeing more and more families downsize, move out of expensive inner‑city areas, or relocate to more affordable parts of the country. In fact, over one in ten family moves are into smaller homes with fewer bedrooms, and one in four are selling properties worth significantly more than the homes they’re moving into. These aren’t always lifestyle moves; for many, it’s about making finances work in a challenging economic climate.
“Remote work flexibility has been a major driver of this trend, allowing more families to move away from city centres while still maintaining work‑life balance without the burden of long commutes. While affordability is clearly a key factor in family moves, our research also suggests that lifestyle and space are important. Families are seeking homes that better align with their needs — whether that’s more bedrooms, a backyard, or proximity to nature — which is influencing where they choose to relocate.
“If you’re planning a move, whether it’s across the street or the country, Muval can help take the stress out of relocating. Our platform makes it easy to compare quotes from trusted interstate removalists and book your move in minutes — so you can focus on settling into your new family home.”
About the data
Muval has taken a deep dive into its internal data to find out where Australian families are looking to relocate, what features they look for and the trends we are seeing from their moves.
The research delves into move enquiries on the Muval platform from 2018 – 2025, which includes over 41,111 family move enquiries and 28,773 non‑family enquiries. The regional divisions in this report utilise the Australian Bureau of Statistics’ Australian Statistical Geography Standard to define and compare areas — Greater Capital Cities, SA4, SA2 and SA1 regions. The term region is used to refer to SA4s and Cities for Greater Capital Cities.
A family move is inferred by analysing the number of bedrooms along with the location of the move destination: 3+ bedroom moves into SA1 regions, where the majority of households are families.
A rental property is defined as one that has had a rental listing within 365 days before the move request. All other properties are deemed to be owner‑occupier. Sale prices are taken from Microburbs’ database of online sold listings and state government land registry services. Home features are taken from for‑sale listing descriptions.
Inbound‑to‑outbound ratio is the rate of inbound moves to outbound moves — for example, a ratio of 2 would signify double the number of inbound moves than outbound moves. At the SA2 level, a minimum number of 20 total moves was used to filter the data.
The percentage of moves shows the proportion of where the inbound or outbound moves are coming from. Percentages may not sum due to rounding.
Article by: James Morrell
Share this page on Facebook