
"In the five years since we began publishing the Muval Index, we’ve seen Australians move for countless reasons—seeking space, lifestyle upgrades, better jobs, fleeing COVID lockdowns, or to be closer to family. But over the past 12 months, the more intriguing story is not why people are moving, but rather why they aren’t".
This past year, we’ve witnessed the industry bounce along the bottom of the lowest demand for removalist services in two decades, with Google search interest for removalists and interstate movers falling to levels not seen since search engine statistics began being tracked and made publicly available (2006). Many of the moving companies we partner with have described 2024/2025 as one of the quietest periods in living memory. And behind that silence is a much louder issue: Australia’s deepening housing crisis.
From skyrocketing rental prices to limited housing supply, the challenge of simply finding a place to live—let alone choosing to move—has become overwhelming for many Australians. These pressures came to a head in this year’s federal election, where housing availability emerged as one of the defining issues of the campaign. The conversation has shifted: housing is no longer just an economic talking point, it’s a social and generational concern that touches every household.
This year’s Muval Index doesn’t just reflect where Australians are moving. It reveals where they can move, and increasingly, where they cannot. While some regional areas are thriving as affordable alternatives to capital cities, the overall volume of moves has slowed dramatically. We’re seeing people delay, downsize, or sacrifice key lifestyle elements in order to find a place to call home.
We believe that moving should represent a moment of opportunity and renewal. But this past year it’s also a barometer for deeper structural challenges in our society. It’s our hope that this data can continue to inform those challenges—and help shape the policy, planning and priorities needed to ensure a more mobile, liveable Australia for everyone.
Introduction
We are proud to present the 2025 Muval Index – our fifth annual snapshot of internal migration trends shaping the nation. This year’s report uncovers the regions on the rise, the capital cities losing residents, and the shifting priorities behind why people choose to move. From affordability and lifestyle to job changes and family needs, it provides a comprehensive look at what drives the way we live and where we live.
We’ve seen Google searches for removalists and interstate removalists decrease by 22% since 2019, hitting their lowest level since 2006.
We also explore the theme of housing crisis, which we have seen has had a huge effect on movers over the last year, from driving people away from capital cities to a decrease in the number of people moving home.
The Muval Index combines insights from over 400,000 moving enquiries, along with a nationally representative survey of 2,000 Australians. Together, these datasets offer a detailed and timely picture of real-life migration decisions, revealing not just where Australians are going but the emotional and financial trade-offs they’re making to get there.
The Great Australian Relocation: Capital Cities, Towns, and State Moves
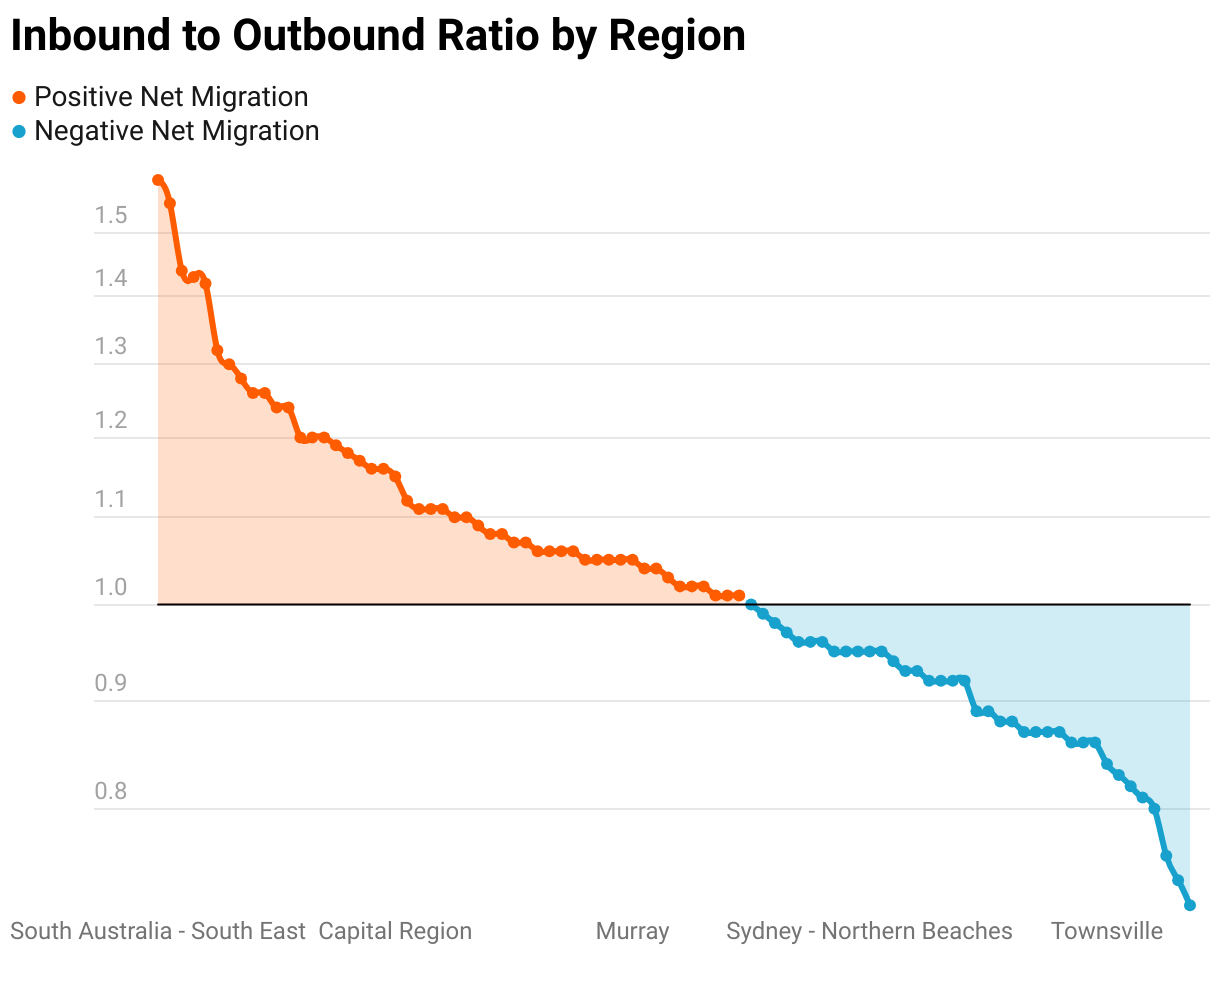
Australia continues to be one of the most mobile populations in the world, with thousands of people packing up and moving house each year. Unlike traditional data sources that often reflect past trends, the Muval Index provides a view of how and where Australians are relocating, capturing shifts in migration patterns as they happen. We measure this through the inbound-to-outbound migration ratio. A ratio of one means the same number of people arriving and leaving. A ratio below one means more people are moving out than in, while a ratio above one means more families are moving into the area than leaving.
Interstate Migration: Who’s Moving Where?
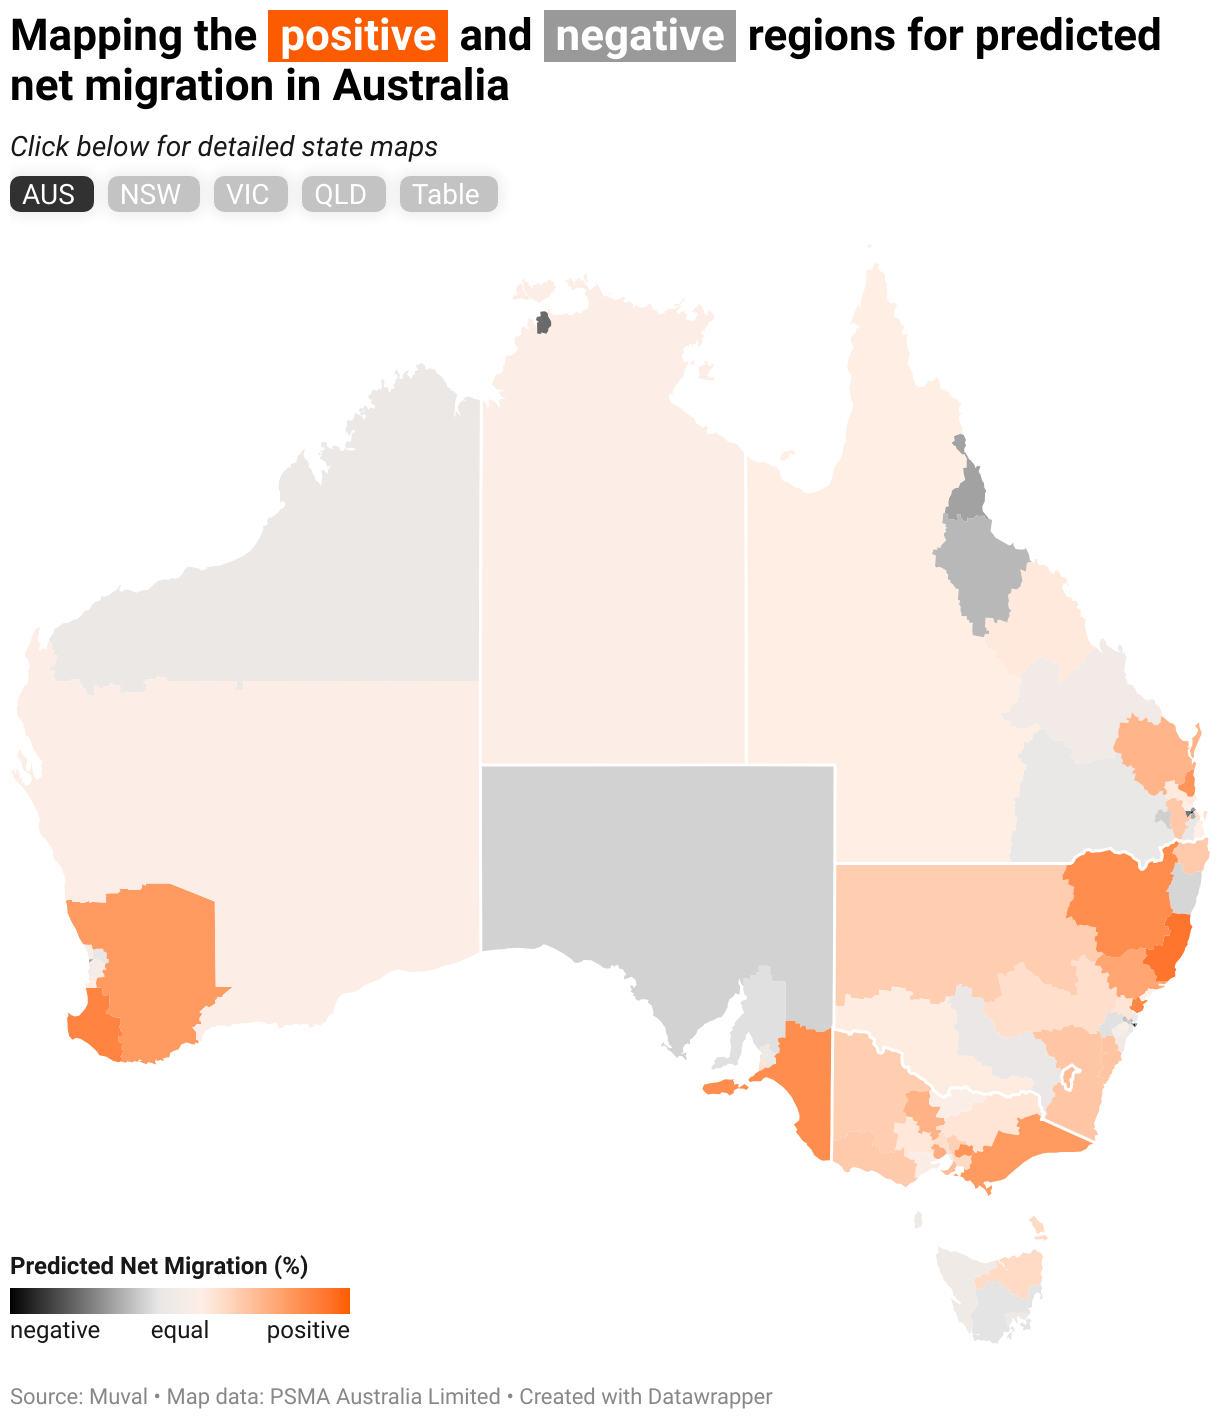
The Australian Capital Territory (ACT) was the most popular state or territory to move to in 2024, with an inbound-to-outbound ratio of 1.2. This means that for every 100 people leaving the ACT, 120 people are moving in. This may be because the ACT is often seen as a liveable, well-connected city with good public services, stable government employment, and high average incomes. It also offers a more affordable and balanced lifestyle than Sydney, making it attractive for professionals and young families.
At the other end of the scale, the Northern Territory is seeing the highest rate of outbound movement. With an inbound-to-outbound ratio of 0.8, for every 100 people who leave, only 80 move in. Outbound migration may be present in this state due to fewer employment opportunities, remoteness, harsher climate, and limited access to services and infrastructure. These factors can make long-term settlement less appealing for many Australians, especially younger or mobile populations.
Tasmania and South Australia are the only states that have an inbound-to-outbound ratio of 1, when rounded to two decimal places, meaning that approximately for every person who moves out, someone else moves in.
Where Aussies Are Moving: Capital Cities vs Regional Shifts
While Western Australia ranks as the third most popular state for relocation overall, it’s regional WA that records the highest inbound-to-outbound ratio of all capital city and rest-of-state areas across the country.
Interestingly, aside from Greater Melbourne, which holds the fifth spot overall, regional areas outperform all capital cities in terms of net migration. This includes regional Victoria, which ranks higher than Greater Melbourne, suggesting a continued shift in preferences toward more affordable living (the majority of Regional Victoria has lower median house prices than Melbourne). More Australians appear to be opting for the space, affordability and slower pace that many regional centres offer, particularly in a post-pandemic world where flexible and remote work arrangements remain more common.
At the other end of the scale, Greater Darwin recorded the lowest inbound-to-outbound ratio of just 0.72. This means that for every 100 people leaving the city, only 72 are moving in.
The most popular regions to relocate to
At the top of the list is South Australia’s South East, which includes the picturesque Limestone Coast and towns like Mount Gambier. With an inbound-to-outbound ratio of 1.59, for every 100 people moving out, almost 160 are moving in. This strong net gain highlights the appeal of regional SA for those seeking affordability, natural beauty, and a slower pace of life, especially as the cost of living rises in major cities.
In second place is Bunbury, Western Australia. With the perfect blend of city convenience and stunning beaches, Bunbury continues to attract movers seeking a lifestyle upgrade without sacrificing connection. Bunbury is particularly popular with families. According to our Family Relocation Report, it recorded the second-highest inbound-to-outbound ratio among families over the past five years. Regional WA makes a strong showing in the top five, with the Wheat Belt also drawing steady inbound movement.
The Mid North Coast of New South Wales ranks third, while Latrobe-Gippsland in Victoria comes in fifth. Both offer the best of regional living with easy access to coastlines, national parks, and growing local infrastructure. They’re well-connected enough for remote or hybrid workers, yet far enough from capital cities to deliver more affordable housing, relaxed lifestyles and a strong sense of community.
The only metropolitan area to make the top 10, Melbourne’s Outer East stands out as a popular suburban choice. It offers more space and family-friendly living without being too far from the CBD, suiting those wanting a city-adjacent lifestyle with a bit more breathing room.
Also featured in the top 10 are NSW’s Central Coast, Wide Bay in Queensland, and the ever-popular Sunshine Coast. These regions continue to appeal to Aussies seeking sunshine, space and lifestyle-led living, whether that’s remote work flexibility, coastal access, or simply more affordable housing options.
The most common regions Aussies are leaving
Many Australians are actively relocating in search of better lifestyles, affordability, or work opportunities, resulting in some areas experiencing a clear net loss of residents. These regions have the lowest inbound-to-outbound migration ratios in the country, meaning more people are moving out than in.
Topping the list is Darwin, which is unsurprising given the previous results, with an inbound-to-outbound ratio of just 0.72. For every 100 people leaving Darwin, only 72 are moving in. Brisbane’s Inner City ranks second-lowest, with a ratio of 0.74. The high cost of living, combined with the shift away from dense urban living in favour of lifestyle-led moves, may be pushing people toward more affordable suburbs or regional Queensland. A similar trend can be seen in Sydney’s City and Inner South (0.76), where ongoing housing affordability challenges continue to drive residents further afield.
These trends show that while city centres and remote areas may have once held appeal, Australians are continuing to reassess what matters most when choosing where to live. Affordability, lifestyle, flexibility and long-term stability appear to be key drivers behind these shifting patterns.
Who is Moving Where?
Looking at where people are moving to, the rest of Western Australia stands out. Over a quarter (28.89%) of those relocating to regional WA came from Greater Perth, suggesting a strong internal shift toward more affordable or spacious living within the state. It’s also drawing interest from interstate movers, with 12.22% coming from Melbourne and 11.11% from Sydney.
The ACT also remains a popular destination, particularly for those from the major capitals. Greater Melbourne accounted for 31.25% of movers into the ACT, followed by Greater Sydney at 19.79%. This likely reflects Canberra’s appeal as a well-connected, relatively affordable city with stable public sector employment and access to top-tier education and infrastructure.
Meanwhile, most people moving to the Rest of Victoria came from Greater Melbourne, which is to be expected. However, the second largest source of movers was the Rest of Queensland, which is a more surprising result.

On the flip side, Greater Darwin has the highest number of people leaving compared to moving to the city. The top destinations for those moving away from the city were the Rest of Queensland (22.22%), Greater Perth (16.67%), and Greater Melbourne (16.67%). This may reflect a desire for stronger job markets, better infrastructure, or milder climates.
Movers from Greater Brisbane headed mostly to Rest of Queensland (28.33%), followed by Greater Melbourne (20.34%) and Greater Sydney (9.69%) and Greater Sydney residents most commonly relocated to Rest of Queensland (19.91%), Greater Melbourne (18.07%), and Greater Brisbane (14.65%), with many likely seeking better housing affordability or work opportunities in more livable urban centres.
How Aussie moving habits have shifted since 2019
New South Wales
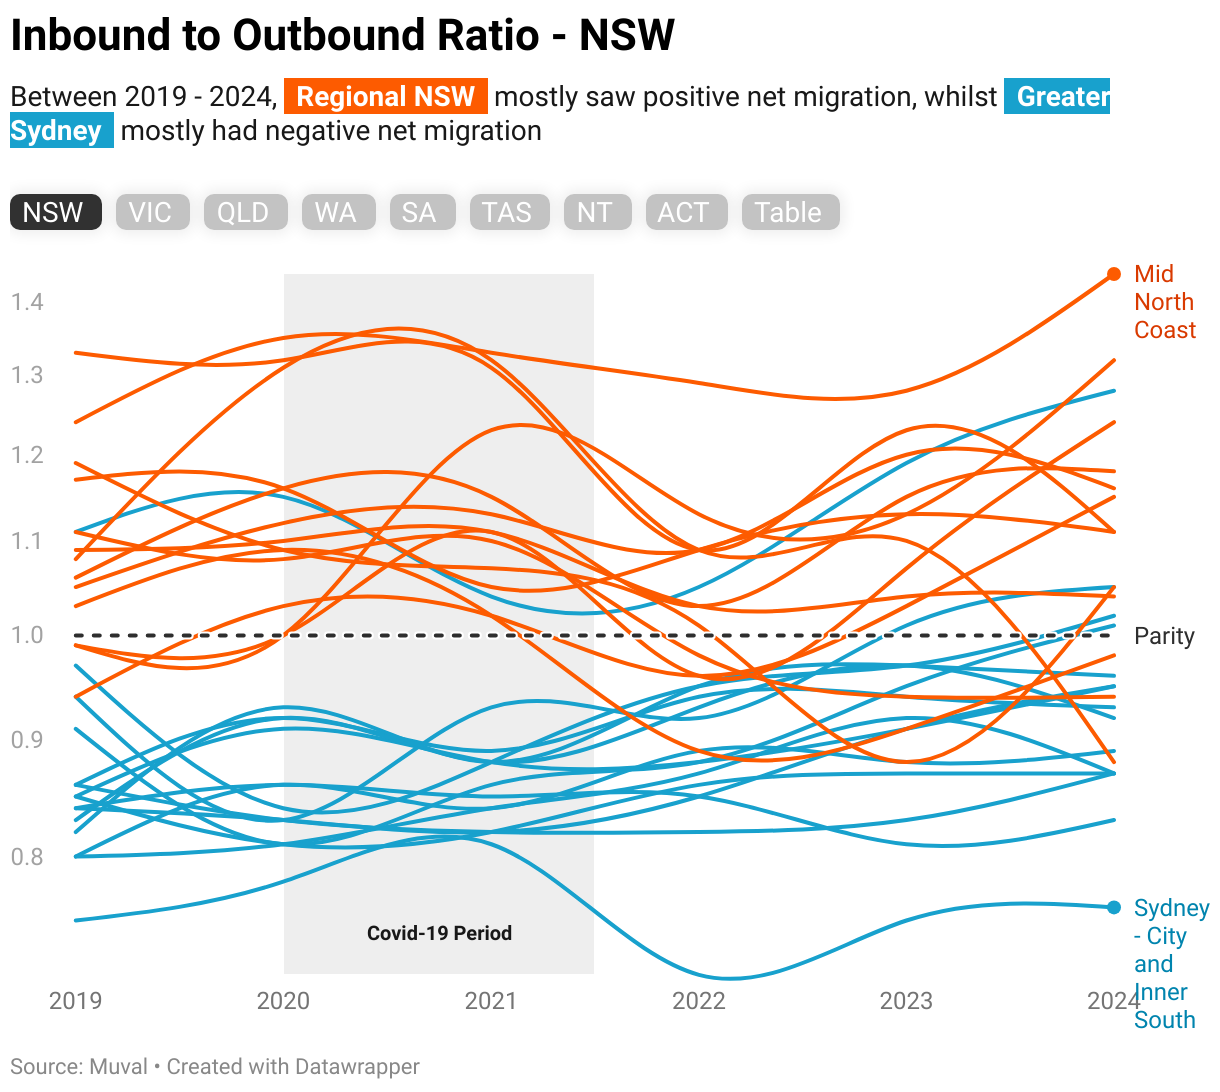
Between 2019 and 2024, migration patterns across NSW reveal a tale of two regions. Regional NSW consistently recorded positive net migration, while Greater Sydney struggled to retain residents, with most of its areas seeing more people move out than in. In fact, just four Greater Sydney regions didn’t follow this trend in 2024: Central Coast (1.28), Baulkham Hills and Hawkesbury (1.05), South West Sydney (1.02), and Outer South West Sydney (1.01). In contrast, only three regional NSW areas experienced more outbound moves than inbound: Illawarra (0.98), Riverina (0.94), and Coffs Harbour–Grafton (0.88). With house prices in Sydney spiralling out of control, almost double that of regional NSW, these moves are unsurprising.
Victoria
Migration patterns in Victoria tell a story of resilience and recovery. During the COVID-19 years, Greater Melbourne experienced a significant population decline, with a sharp drop in migration from 2019 to 2020. However, since then, the city has seen a steady rebound, approaching pre-pandemic levels in 2024, perhaps because of return to office mandates for many workers coming into place. Interestingly, Inner Melbourne is the only region across the state still below parity, with more people leaving than arriving (0.95). Meanwhile, every region in Regional Victoria now enjoys a positive inbound-to-outbound ratio.
Queensland
Popular regions like the Gold Coast, Cairns, and Townsville saw a spike in moves during the pandemic, though many have now settled back to pre-COVID levels or lower. Notably, Inner City Brisbane continues on a downward trend, with its inbound-to-outbound ratio falling from 0.91 in 2020 to just 0.74 in 2024.
Western Australia
Regional WA has seen a surge in popularity, led by Bunbury and the Wheat Belt — two standout regions with significant year-on-year growth from 2023 to 2024. While Greater Perth had seen strong momentum before COVID, migration has since declined, as regional WA continues to gain ground.
South Australia
Migration trends in South Australia have been mixed over the past six years. While Greater Adelaide experienced a general dip in net migration since 2019, recent growth in 2024 offers signs of recovery. Regional SA, on the other hand, has been more volatile. The South East leads the way with an impressive 42% growth in inbound moves from 2023 to 2024, cementing its position as the state’s top migration hotspot. Meanwhile, the Barossa–Yorke–Mid North region, which saw strong growth after the lockdowns, is now showing a 34% decline. Adelaide South is the only Greater Adelaide region to post a positive migration ratio, at 1.10.
Tasmania
Despite seeing a boost in migration during the pandemic, Tasmania has since experienced a marked downturn. Two of the three Regional TAS areas, the West and North West, and the South East, now have more people moving out than in. Greater Hobart also recorded a negative net migration. However, there is some optimism: Launceston and the North East have rebounded after two years of decline, climbing to an inbound-to-outbound ratio of 1.19.
Northern Territory
In the Northern Territory, migration has diverged significantly between the two regions. Starting at the same ratio of 0.83 in 2019, Regional NT has surged to a positive ratio of 1.06, a 25% increase since 2022. In contrast, Greater Darwin has faced a consistent downturn, sliding further into negative migration territory year after year.
Australian Capital Territory
The ACT continues to be one of the most stable performers nationally when it comes to net migration. Throughout the 2020s, it has maintained a positive inbound-to-outbound ratio, consistently hovering between a ratio of 1.1 and 1.3. This suggests steady demand for Canberra’s unique blend of career opportunities, lifestyle, and liveability, even amid broader shifts in the national housing landscape.
MuveRank 2025: A Real-Time Look at Migration
This year's Index releases 2025's MuveRank data. MuveRank provides a real-time view of migration patterns at the local government area (SA4) level, making it possible to track the ebb and flow of population movement down to specific regions.
MuveRank shows the total net migration across Australia, with 1 being the "highest" rank, and 88 being the "lowest" rank.
Behind the Data: Insights from Australian movers
The Muval Index also explores the evolving lifestyle and housing preferences of Australians. We surveyed 2,000 people to find out if they had moved house in the past 12 months, or were planning to move in the next 12. More than a quarter (28%) said they had either recently moved or were planning to move within the next year.
Breaking that down, 23% had moved house in the past 12 months, while 28% said they were considering relocating in the year ahead. Interestingly, 21% of those planning to move again had already moved within the past year, perhaps suggesting that one in five recent movers may be dissatisfied with their current situation or may reflect the instability and churn within the rental market.
The key reasons Aussies move house
Among respondents who had either moved in the past 12 months or were considering a move in the next 12, the most common reason cited was a desire to upgrade to a better home. While this reason rose from second to first position in this year’s Index, the overall percentage of people selecting it has declined from 38% in 2024 to 35% in 2025. This slight drop may reflect ongoing challenges in the housing market, such as limited stock, rising interest rates, and affordability constraints, making it harder for people to achieve the upgrade they want.
Taking second place is the motivation to reduce the cost of living, which rose from 29% last year to 32% in 2025. This jump is likely a reflection of continued financial pressure on households, with many Australians reassessing where and how they live in order to manage day-to-day expenses, including rent, mortgage repayments, and utility bills.
Needing more space moved up to third place, overtaking lifestyle-driven moves. As families grow or hybrid working arrangements become the norm, having extra room, whether for a home office, kids, or simply a bit more breathing space, is becoming a higher priority.
Meanwhile, seeking a better lifestyle has dropped to fourth place overall, with just one in five respondents selecting it as their main reason for moving. While lifestyle remains a key motivator for many, it’s clearly taking a back seat to more practical and financial priorities in the current economic climate.
For those who had already moved in the past 12 months, lifestyle factors were even less influential, ranking as low as seventh place. In contrast, a change in relationship status, often an unplanned or unexpected life event, emerged as the third most common reason for recent moves. This was followed by needing more space, downsizing, and relocating for a new job or work opportunity.
These results suggest that for many Australians, recent moves have been driven less by aspiration and more by necessity, life changes, or financial pressure, a shift that reflects the uncertain and fast-changing conditions many households are navigating today.
Top priorities vs trade-offs
The most important factors Aussies are looking for in a new home
When it comes to choosing a new place to live, Australians are prioritising practicality, safety and affordability over luxury or lifestyle features. According to this year’s Muval Index, affordable price overwhelmingly tops the list of must-haves, with over three-quarters (78.1%) of respondents saying it’s the most important factor when searching for a new home. With interest rates still high and the cost of living rising, it’s clear that getting good value is the number one priority for most movers.
Safety comes in second, with over half (50.7%) of respondents saying a safe neighbourhood is essential. Rounding out the top five are access to public transport (36.9%), proximity to work or study (36.0%), and home size (33.8%). These show that functionality and convenience are front of mind for movers, whether that’s an easier commute, space for a growing family, or meeting the practical demands of everyday life.
Other notable priorities include being close to family and friends (30.9%), finding a pet-friendly property (25.4%), and having good access to shops, cafes and other amenities (25.2%). Storage or garage space (25.2%) and low-maintenance homes (24.5%) also made the top 10, reflecting a desire for homes that suit busy, modern lifestyles.
What Australians Are Willing to Sacrifice for an Affordable Home
With rising property prices and cost-of-living pressures, four in five Australians say they’ve had to sacrifice, or would be willing to sacrifice, something meaningful to secure a home they can afford. The most common sacrifice? Proximity to the beach or coast, with 27.5% of respondents saying they’ve let go of the dream of seaside living in favour of something more affordable inland. This suggests that while lifestyle is still valued, affordability is the ultimate deal-breaker.
Being close to family and friends was the second most sacrificed factor (25.2%), highlighting how housing pressures are forcing people to move further away from their support networks. Similarly, many have given up access to desirable features like a swimming pool (25.0%), or compromised on the size of their home, including bedrooms and bathrooms (20.7%).
Others have made longer-term trade-offs, such as settling for a property with less future investment potential (20.1%) or choosing homes with dated interiors (19.6%) to stay within budget. Even essentials like public transport access (19.6%), good schools nearby (18.5%), proximity to work or study (17.6%), and storage or garage space (17.3%) are being deprioritised in favour of simply being able to afford a place to live.
Beyond the move: What else is going on in Aussies' lives?
This year’s survey revealed a slight dip in major life plans that often come with a big financial commitment. Only 5.7% of respondents said they were planning to have a child in the next 12 months, down from 7.0% last year. Similarly, 20% said they were planning to start a new job, compared to 24% in 2024. Even plans for overseas travel have declined slightly, with 53% planning an international holiday, down from 56% last year.
While these changes may seem small, they could reflect a broader mood of financial caution and job uncertainty. With the cost of living continuing to rise, Australians may be putting off big life decisions, including moving home, in favour of stability and predictability. These subtle shifts in personal plans suggest that everyday expenses are starting to reshape how, when, and even whether people choose to move.
Looking ahead
"The 2025 Muval Index gives us a real-time lens into how Australians are responding to the pressures and possibilities of a changing world. We’re seeing clear signs that affordability, flexibility and quality of life are reshaping how people choose where to live, and that trend isn’t slowing down."
As we look ahead, the combination of ongoing cost-of-living pressures and rising house prices is likely to continue driving movement away from capital cities and toward more affordable regional hubs. These areas not only offer better value when it comes to buying or renting a home, but also appeal to Australians seeking safer communities, a slower pace of life, and the benefits of coastal or country living.
About the data
The data for the Muval index comes from a nationally representative sample survey run by PureProfile and anonymised removalists enquiry data from the Muval platform.
MuveRank rankings are developed in collaboration with leading population geographers at The University of Queensland. The data comes from more than 400,000 de-identified and anonymised records of planned moves by Muval users, spanning from 2019 to 2024. No personally identifiable information has been used in this analysis. These records were geocoded according to the Australian Statistical Geography Standard and cleaned to ensure accuracy, removing entries with insufficient address information. The analysis was carried out by creating origin-destination matrices at multiple geographical levels, providing a granular view of migration patterns.
This data was then compared to two sources of official statistics from the Australian Bureau of Statistics: the Regional Internal Migration estimates and the 2021 Census data. The comparison involved regressing quarterly Muval data against these official datasets to assess correlations and identify any biases, particularly towards capital city regions and Greater Melbourne. The insights from this regression analysis helped refine the models used to predict migration flows.
For the purposes of this analysis, the term “region” is used to refer to the Statistical Area level 4 (SA4), and the term “city” is used to refer to the Greater Capital City Statistical Areas (GCCSA) as described by the Australian Bureau of Statistics.
Two key measures used in this analysis are:
- Inbound-to-outbound ratio: the rate of inbound moves to outbound moves — for example, a ratio of 2 would signify double the number of inbound moves than outbound moves.
- Net migration rate: the difference between the number of inbound and the number of outbound migration as a proportion of the population - for example, a net migration rate of +0.86% means there has been a growth of 8.6 people per 1,000 population in the region.
The net migration rate provides the basis for the MuveRank, with rank number 1 being equivalent to the region that has the greatest net migration rate in the country.
Other Muval Index reports
- Muval Index 2025 - Housing Crisis
- Muval Index 2024 - The New Great Australian Dream
- Muval Index 2023 - Rates, Rents and Relocation
- Muval Index 2022 - From COVID to Cost of Living
- Muval Index 2021 - Unboxing the Relocation of the Nation
Article by: James Morrell